
UPDATE 4/8/2025: We have closed our recommendation of GTLS today as the company has received an offer from Baker Hughes for $13.6 billion.
Good morning,
This week we’re writing about a compelling opportunity in the energy infrastructure space that we regard as significantly undervalued.
With a transformative merger set to unlock nearly $4 billion in synergies, we believe this US company can become an industrial powerhouse combining defensive cash flows and sustainable growth.
We first wrote about this company in 2022 when the market severely overreacted to news of an acquisition. Who would have thought a similar situation would occur less than three years later?
Let’s dive in…
Introducing Chart Industries
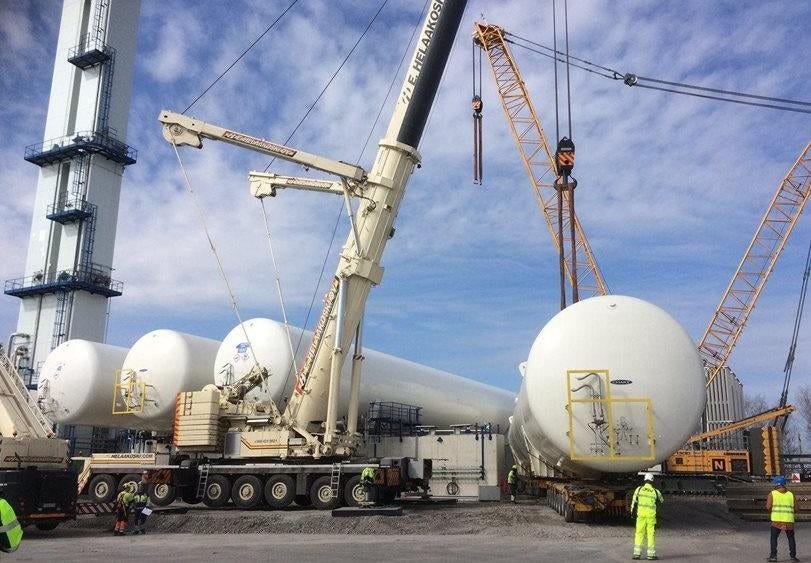
Chart Industries (GTLS) sells products and services to companies that utilize gasses in their production process. They supply equipment used in liquefaction, separation and purification of hydrocarbons, and industrial gasses. Their cryogenic and thermal systems are used by energy and chemical companies to turn raw gas into marketable products. They also provide aftermarket services. (Liquefaction is the process of turning a gas into a liquid by cooling it down and/or increasing its pressure. It is usually done to store and transport gasses.)
Chart’s equipment is primarily used for the following purposes:
1. Liquefaction - Turning gases like Hydrogen, helium and natural gas into liquids for transportation and storage.
2. Storage - Cryogenic tanks and high-pressure containers to store these gases safely.
3. Compression - Machines that pressurize gasses and make them easier to store or move through pipelines.
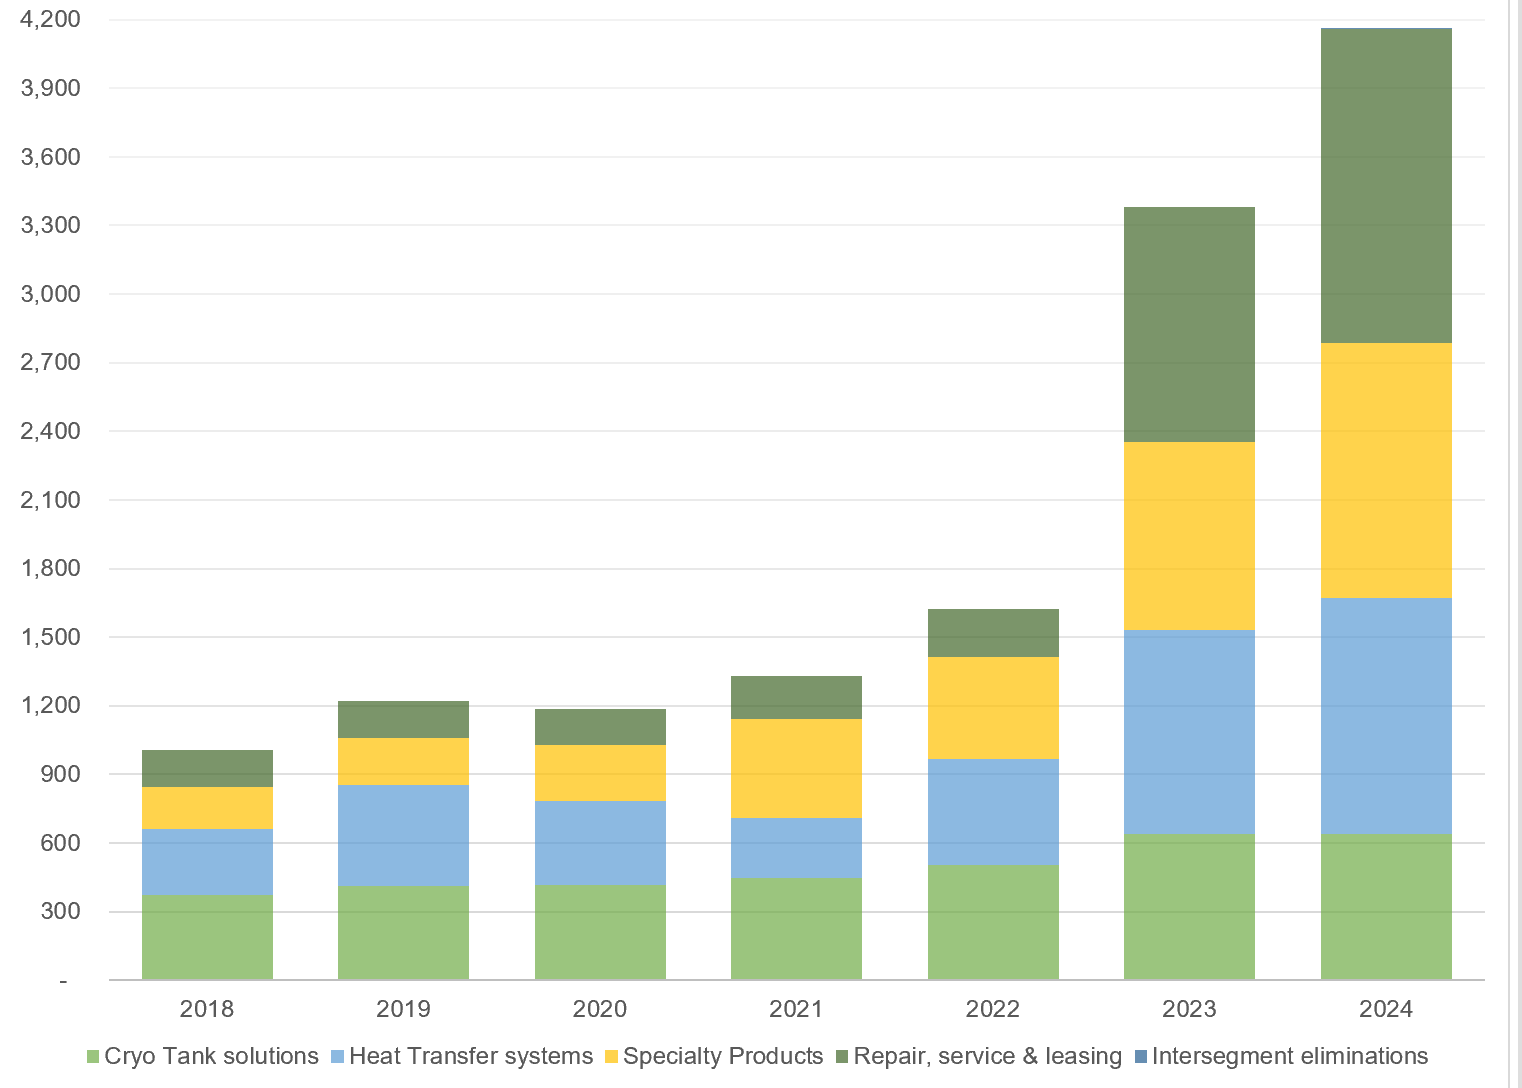
Chart operates through the following segments: cryogenic tank solutions, heat transfer systems, specialty products and repair services & leasing services. The chart below shows the revenue from different segments:
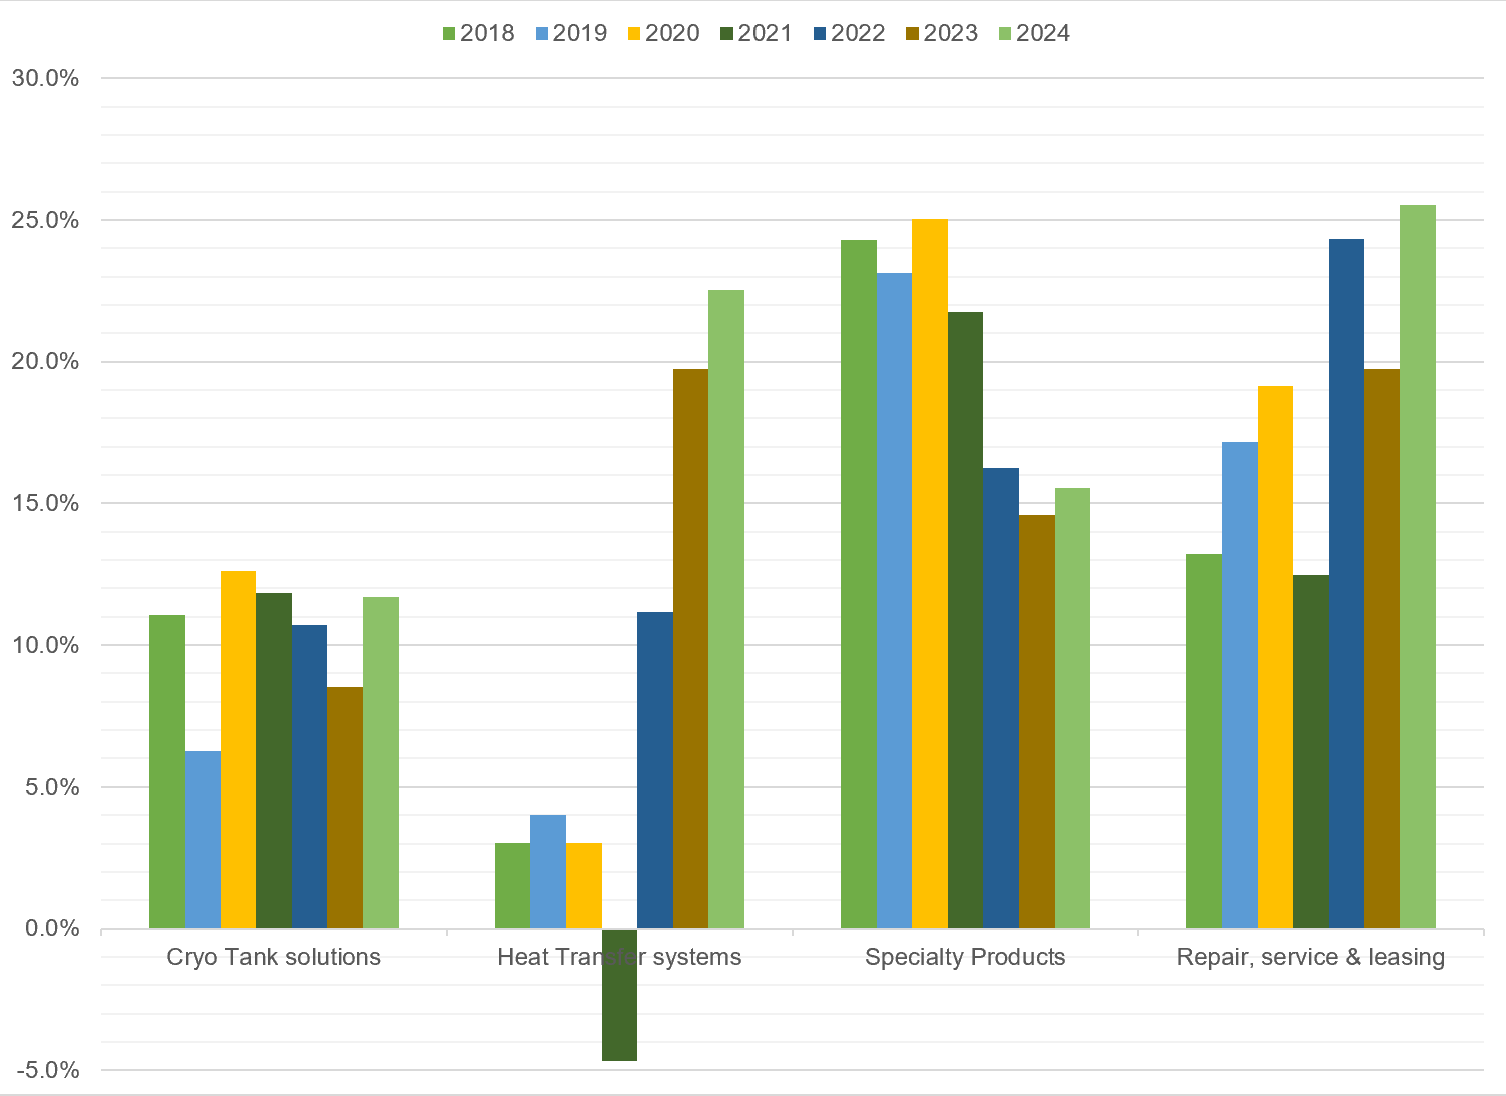
The next chart shows how the Operating margins for different segments have evolved:
Cryogenic tank solutions allows firms to store and transport liquefied gases at extremely low temperatures (-160 C to -253 C). These includes cryo storage tanks, mobile tankers (for transportation), containers for intermodal transportation, cylinders (portable storage for labs) and vacuum insulated tanks. The major users of cryogenic gas solutions are industrial gas producers and distributors. Also, chemical producers, manufacturers of electrical components, health care organizations and companies in the O&G industries.
Heat transfer systems are used to transfer heat or cold to maintain temperature in industrial processes, removing impurities from gases, capturing and reusing energy. 25% of their revenues comes from the heat transfer system segment which supplies equipment to petrochemical & natural gas processing, petroleum refineries, power generation, and industrial gas companies.
Their products in the specialty segment (27% of revenue) make niche cryogenic and thermal systems. They are used in industrial processes by food & beverage companies, LNG system for over-the-road trucks, aerospace, carbon capture, nuclear, lasers in precision manufacturing, biofuels, metals & mining, water treatment etc. They make heat exchangers (used to transfer heat between liquids or gases) and axial fans for data centers, which is a market where they are seeing a lot of growth.
In Q1FY25 they also saw growth from the space exploration market, nuclear and marine industries. Q1 orders from these markets were higher than total FY24 orders from these markets. They also use Ventsim, their proprietary mine and tunnel ventilation software used in road tunnels, mines, subways to manage and monitor airflow, heat, gases and other ventilation information.
Repairs, services and leasing (RSL) makes up more than 33% of their revenues. They have over 50 service centers globally. Aftermarket services includes extended warranties, plant start-up, parts, 24/7 support, monitoring and process optimization, as well as repair, maintenance, spares, and retrofitting.
In other words, Chart is a highly diversified industrial with a proven history of service growth and incorporating new acquisitions.
Business Dynamics
Quality, technical expertise and timeliness are important for the business and contracts are bid for on a competitive basis. Also, heavy regulations means the focus is on reliability. Any issues in Chart’s products could lead to plant shutdowns. The company maintains product liability coverage, which is why quality is very important for them.
Demand for their products is driven by an increasing focus on energy access and security, focus on decarbonization (LNG), data center growth and aging infrastructure (repair and retrofitting segment) etc.
The company has grown through a series of acquisitions and by capitalizing on emerging opportunities in various markets. In 2024, international markets accounted for 60% of total revenue. This marks a significant shift from 2022, when North America contributed 61% and Asia Pacific only 12%. By 2024, North America's share had declined to 45%, while Asia Pacific's increased to 22%, reflecting the company’s deeper penetration and growing opportunities in the APAC region.
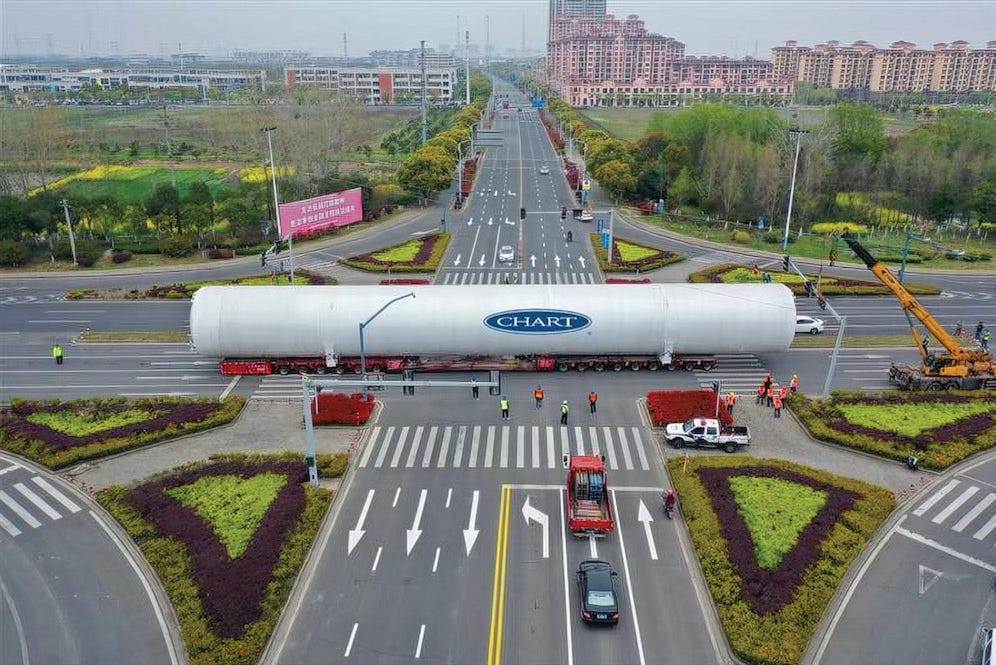
source: businessalabama.com
Merger Of Equals
Flowserve and Chart announced a $19B all-stock merger on 4th June 2025. Chart will receive 3.125 Flow shares for every 1 Chart share and Chart will own 53.5% of the combined company, while Flow will own 46.5%.
Flowserve makes pumps, control valves, pressure seals and it serves oil & gas, petrochemicals, power, water, LNG and chemical industries. They also have a strong aftermarket services segment.
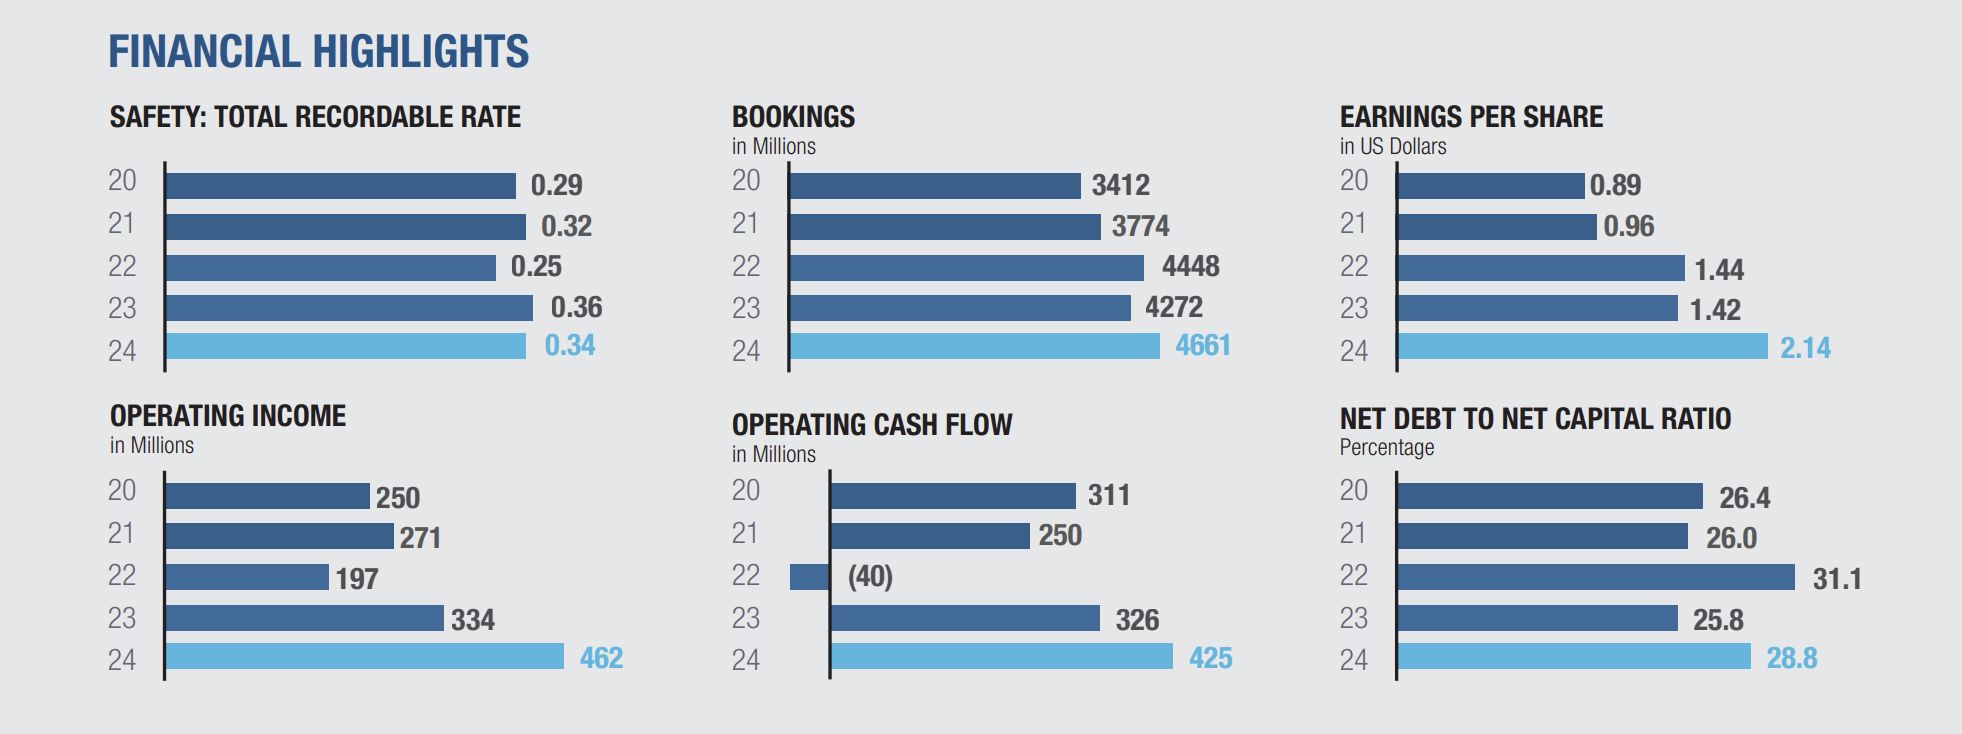
Flow has lower margins and they are currently on a journey to improve their margins. Their financial performance has improved in the last few years:
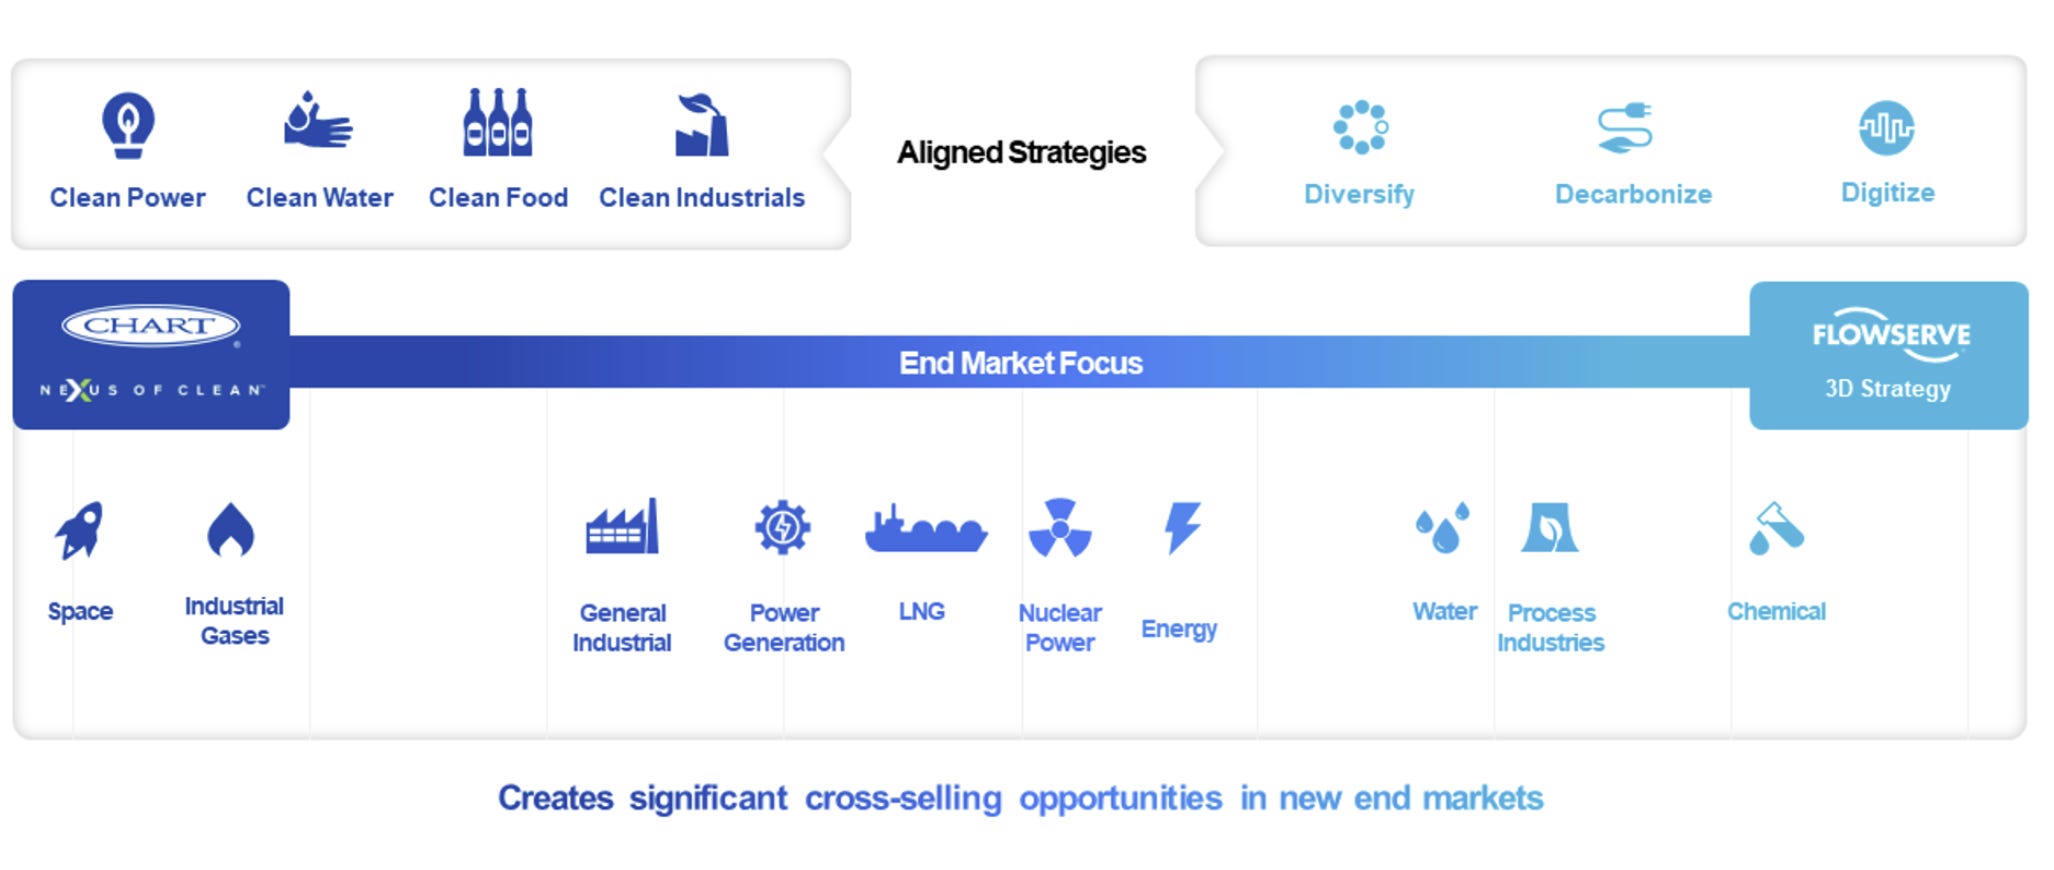
Together, post-merger they will offer a full solution, from gas compression and liquefaction to storage, flow control, and final delivery.
Chart provides hydrogen technology across the entire value chain—including production (hydrogen liquefaction equipment), transportation (cryogenic tanks), storage (vacuum-insulated tanks), and end-use applications (fueling stations, hydrogen compressors, and heat exchangers). Flowserve complements this value chain with its valves, pumps, and seals, which are critical for flow and pressure control, leakage prevention, and efficient loading and unloading.
Howden Acquisition
In 2023, Chart acquired Howden, a deal which was first met with skepticism but later turned out to be accretive. The deal allowed Chart to provide aftermarket services but they still have a lot of room to grow in different geographies in this area. The focus is on servicing clients globally and the Flowserve merger will help them expand to Asia Pacific (Malaysia, Thailand, Middle East), since Flow has a much stronger presence in those markets.
The Opportunity
Growing through mergers and acquisitions is part of Chart’s business strategy. They have continuously done this to take advantage of synergies and market opportunities and the Howden acquisition of 2023 is such an example. This acquisition was a success – exceeding cost and commercial synergies by 33% within two years. It helped Chart to expand its global footprint, secured their largest ever hydrogen compressor order (possible because of Chart and Howden tech) and also decreased the net leverage ratio from 3.35 in 2023 to 2.5 to 2024. They also expanded their durable aftermarket service and repair business with 40%+ gross margins. RSL gross margins were around mid-30s pre acquisition and increased to mid-40s after. They also leveraged Howden’s digital offerings - Ventsim used for remote monitoring.
The focus on growing the RSL segment is because revenues in this segment have shown stickiness, even when economic uncertainty was high. Customers are more focused on maintaining their asset base than purchasing new equipment during times of high uncertainty, which leads to focus on repair and retrofitting spending.
There is also significant room for growth across various geographies. With a focus on serving clients globally through their RSL (Repair, Service & Leasing) segment, the merger with Flowserve will enhance their ability to expand offerings in regions such as Asia Pacific—including Malaysia, Thailand and the Middle East. RSL is the high margin segment of their business (47% gross margins in FY24, up from 38% in FY22). RSL margins are also dependent on volume growth, which is another reason the company is focused on growing revenues in the RSL segment.
LNG companies have seen increased activity in the last few years and are still going strong. Some of the other opportunities includes increased demand in Asia and Middle East in compressors and steam turbines and interest in fans, air coolers and cryogenic cooling. Additionally, the company anticipates a $400M opportunity in the data center market over the next 12-18 months. The Flow merger will further help them with cross-selling in these markets and increase their presence in the aftermarket services segment.
Pre-Merger
Pre-merger Chart had $5.14B in backlog after Q1FY25 (up from $4.845B at the end of 2024 and $4.278B in 2023). Consolidated orders were more than $5B as of Dec 31 2024, and increased by $1.32B in Q1FY25 orders. They define backlogs as orders which have been signed by the firm or other contractual arrangements.
Financial Highlights
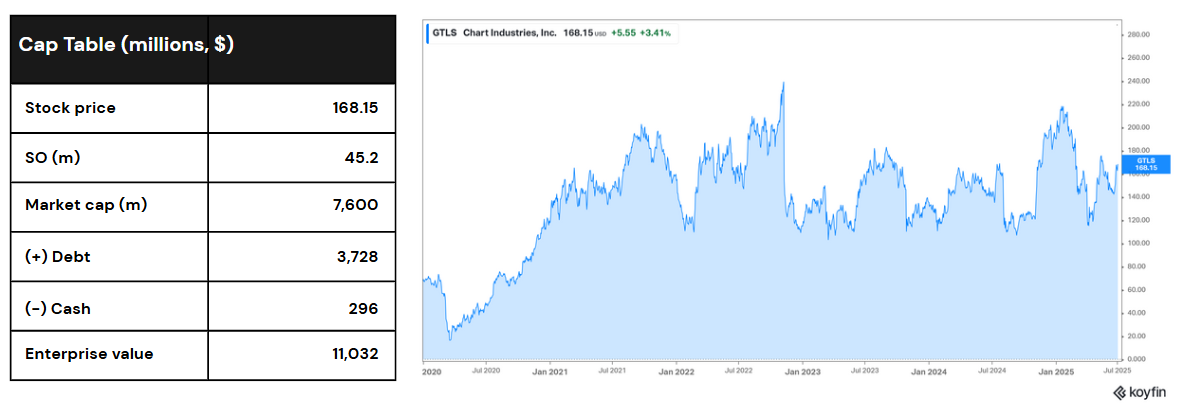
Currently $3.75B in debt and around $300M in cash, with a market cap of $7.4B. However, more than 82% of the debt is due after 2030. The interest costs are quite high (more than 8.5%), due to most of that debt being taken up in 2023—a period of high interest costs.
In FY2024, sales, GM and OPM all grew. Sales growth was broad-based, across all 4 segments.
They have more room for margin improvement as SG&A is likely to decline with restructuring costs from Howden likely to decrease.
Currency movement affected their revenues negatively in 2024. It’s likely that effect will be reversed in 2025.
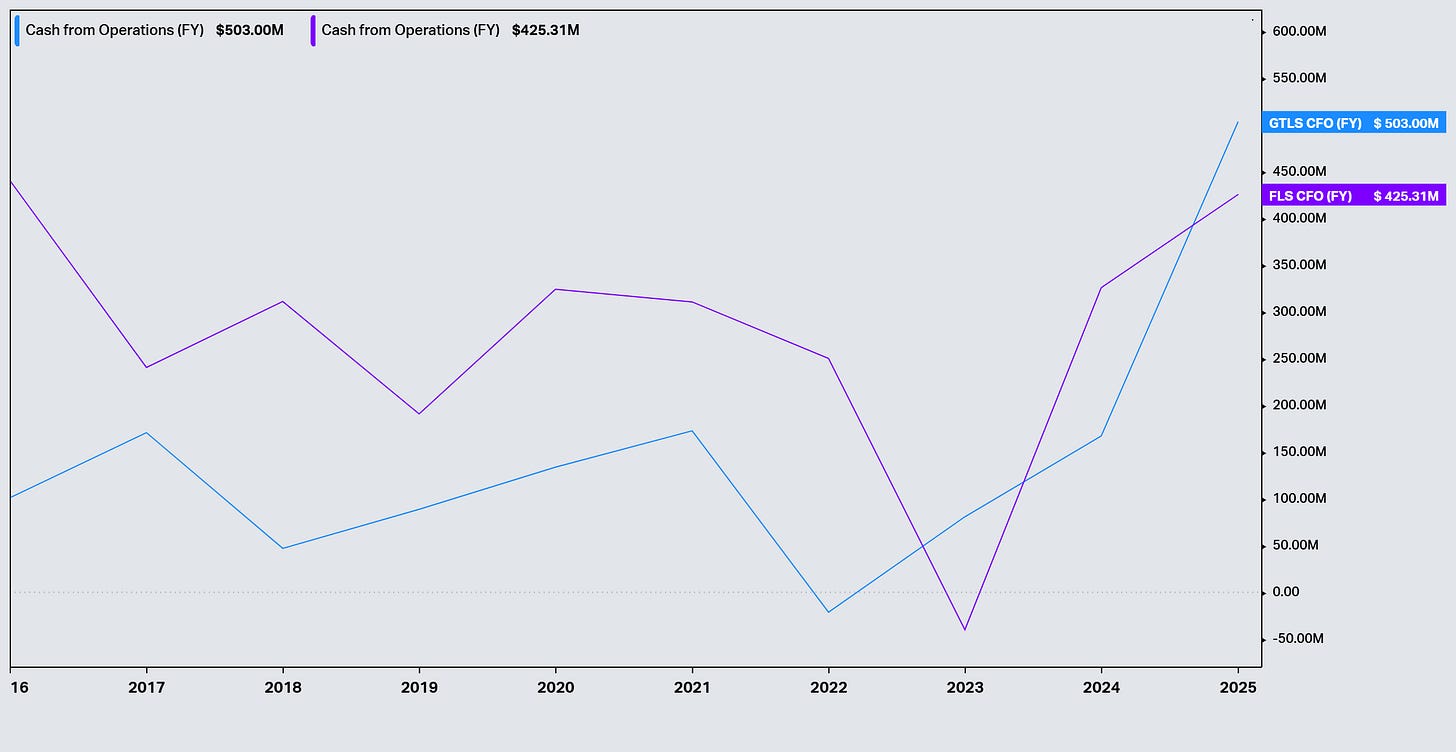
CFO in 2024 was $503M, $335M higher than 2023. Chart’s synergies and focus on operational efficiencies have helped to improve their margins. Additionally, lawsuit claims settled in 2023 affected CFO by $73M.
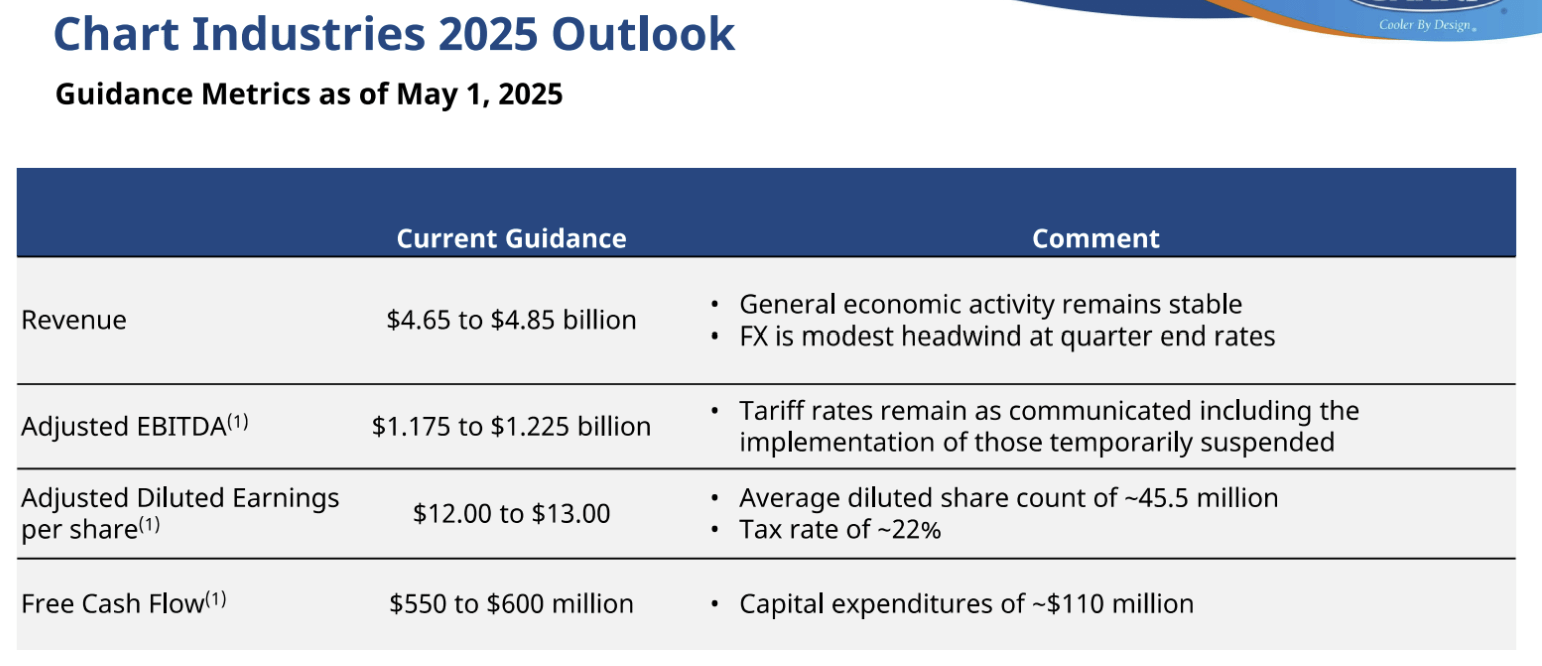
Before the Flow acquisition—Capex in 2025 was expected to be around $110M . After the acquisition it is expected to be round 2% of the combine company sales.
The company does not plan to raise any cash; they believe cash from operations will be enough. They also have no plans to pay dividends.
They have exposure to a number of international markets like China, UK, Europe, India, Canada, Saudi Arabia.
Their book to bill ratio is expected to be 1+ in FY25. In Q1FY25, Book to bill was 1.3, higher than 1.2 in Q1FY24 indicating continued strong demand even with tariff uncertainties.
Specialty products margins recovered and were higher than 30% for the first time since FY22.
RSL (repairs, services and leasing) segment now makes up 1/3rd of their revenue and half of their operating profit.
GPM for HTS (Heat Transfer Systems) and specialty products segments were in the mid-30s. Mid-20s for CTS (Cryo Tank Solutions) and RSL was mid-40s.
LNG pipeline demand continues to be strong.
Overall, the company estimated $50M impact from tariffs. Steel and aluminum tariffs have increased from 25% to 50%, however the overall tariffs on China have reduced to 10% since they posted this estimate. They have an exemption to import aluminum sheets duty-free till September 2025 and they have flexible manufacturing to dodge tariffs.
They also have a strong manufacturing footprint in the US and most steel is sourced domestically. For existing backlogs their costs are locked in.
2nd half of 2025 is expected to be better than 1st half of the year due to timing.
They primarily manufacture cryogenic tanks, materials for industrial gas and power generation in China.
We have seen that Chart and other companies have learned from the 2021 supply chain crisis to be flexible with their manufacturing, and took swift action after the 2025 Trump tariffs. Chart does not expect any substantial impacts.
They also made a few divestitures. They sold off the Roots business for $300M, which was acquired as a part of the Howden acquisition. They also sold other businesses for $175M. Again stating their focus on growing through acquisitions while still remaining efficient and focused in their products and services.
Pre-merger Guidance
Post-Merger
After the merger announcement on June 4th Chart Industries stock fell 9% and Flowserve stock fell 6%. However, since then both stocks have erased those losses and the stock prices are in green. We also saw a positive market reaction after Jefferies posted a positive outlook on the Flow and Chart merger a few days ago, which pushed the stock price of Chart up 10% in the last 5 days. Something similar happened around their Howden announcement.
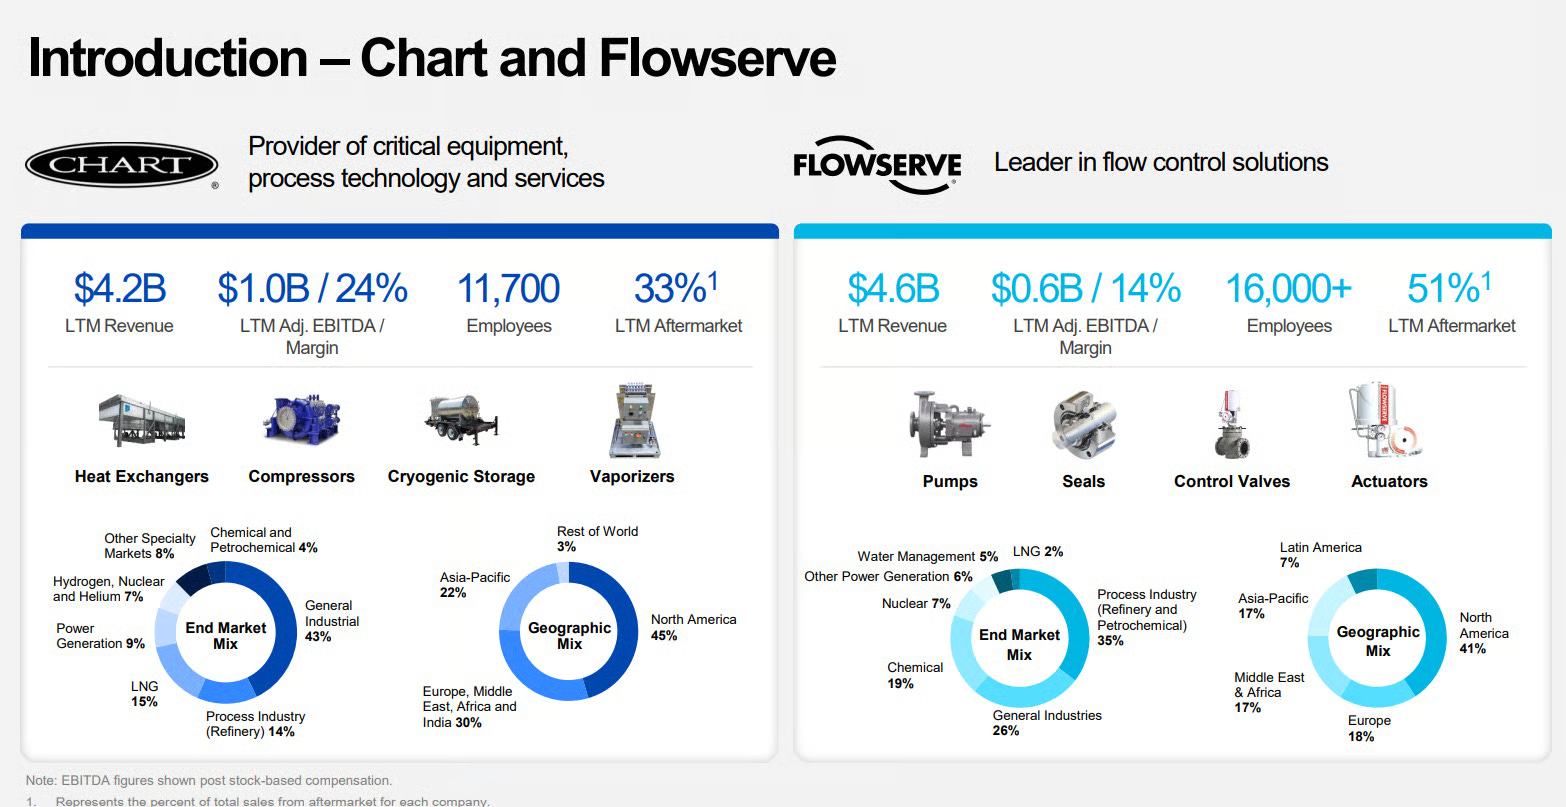
Post-merger, Chart CEO Jillian Evanko will serve as the board chair; Flow CEO will serve as the CEO and the 12 board of directors will comprise of 6 people from each company. Transaction is expected to be closed in Q4FY25 and the new company name hasn’t yet been decided.
Some of the post-merger benefits include:
They’ll now have 200+ locations globally – 150+ Flow and 50+ Chart locations. They plan to expand aftermarket services coverage from 40% to 80% of the installed base.
The merger will produce $300M annual cost synergies, which will be fully realized in the next 3 years. Cost synergies will come in from year 1 (25% in year 1 and 33% or more expected in year 2). Synergies will include organizational efficiencies (engineering, design, aftermarket services), material procurement savings and physical locations consolidation. Additionally, the RSL segment can drive gross margin growth as both companies aftermarket services have mid 40s gross margins, which still have room for improvement as aftermarket services is a high margin segment. Higher content coverage and aftermarket leads to higher margins and aftermarket revenues are stickier. RLS segment is more recession proof and as LNG investment declines over the coming years (after the ongoing wave of heavy energy investment) the RSL segment will become more important for them.
Revenue synergies will contribute by driving 2% incremental revenue growth for the combined company. The merger is also expected to amplify the data center opportunities by 25%. Revenue synergies will show up in year 2 and 3. There is nothing that suggests cannibalization of revenue either. Chart believes 75-80% of industrial applications they serve involves a flow element which will allow for cross-selling.
The merger will also lead to a stronger balance sheet for the combined company. In Q1FY25, the net leverage ratio (Net debt/Adjusted EBITDA) was 2.91. The expected net leverage ratio of the combined company will be between to 2.0-2.5x by the end of 2025. An all stock merger allows them to maintain the investment grade rating.
The merger will also support cross-selling, full life cycle support and combining Flow’s IOT (RedRaven) and Chart’s digital platform (Ventsim) to monitor data of rotating equipment and generate more subscription revenue.
This merger will also help improve volatility in earnings. Historical revenue volatility should improve by 4% after the merger. The divergence in GTLS and FLS cash flow can be seen below:
Flowserve has a strong footprint in Asia pacific. Synergies will help them take advantage of energy markets globally (both companies are focused on energy access/security/intensity and decarbonization).
Post-Merger Guidance
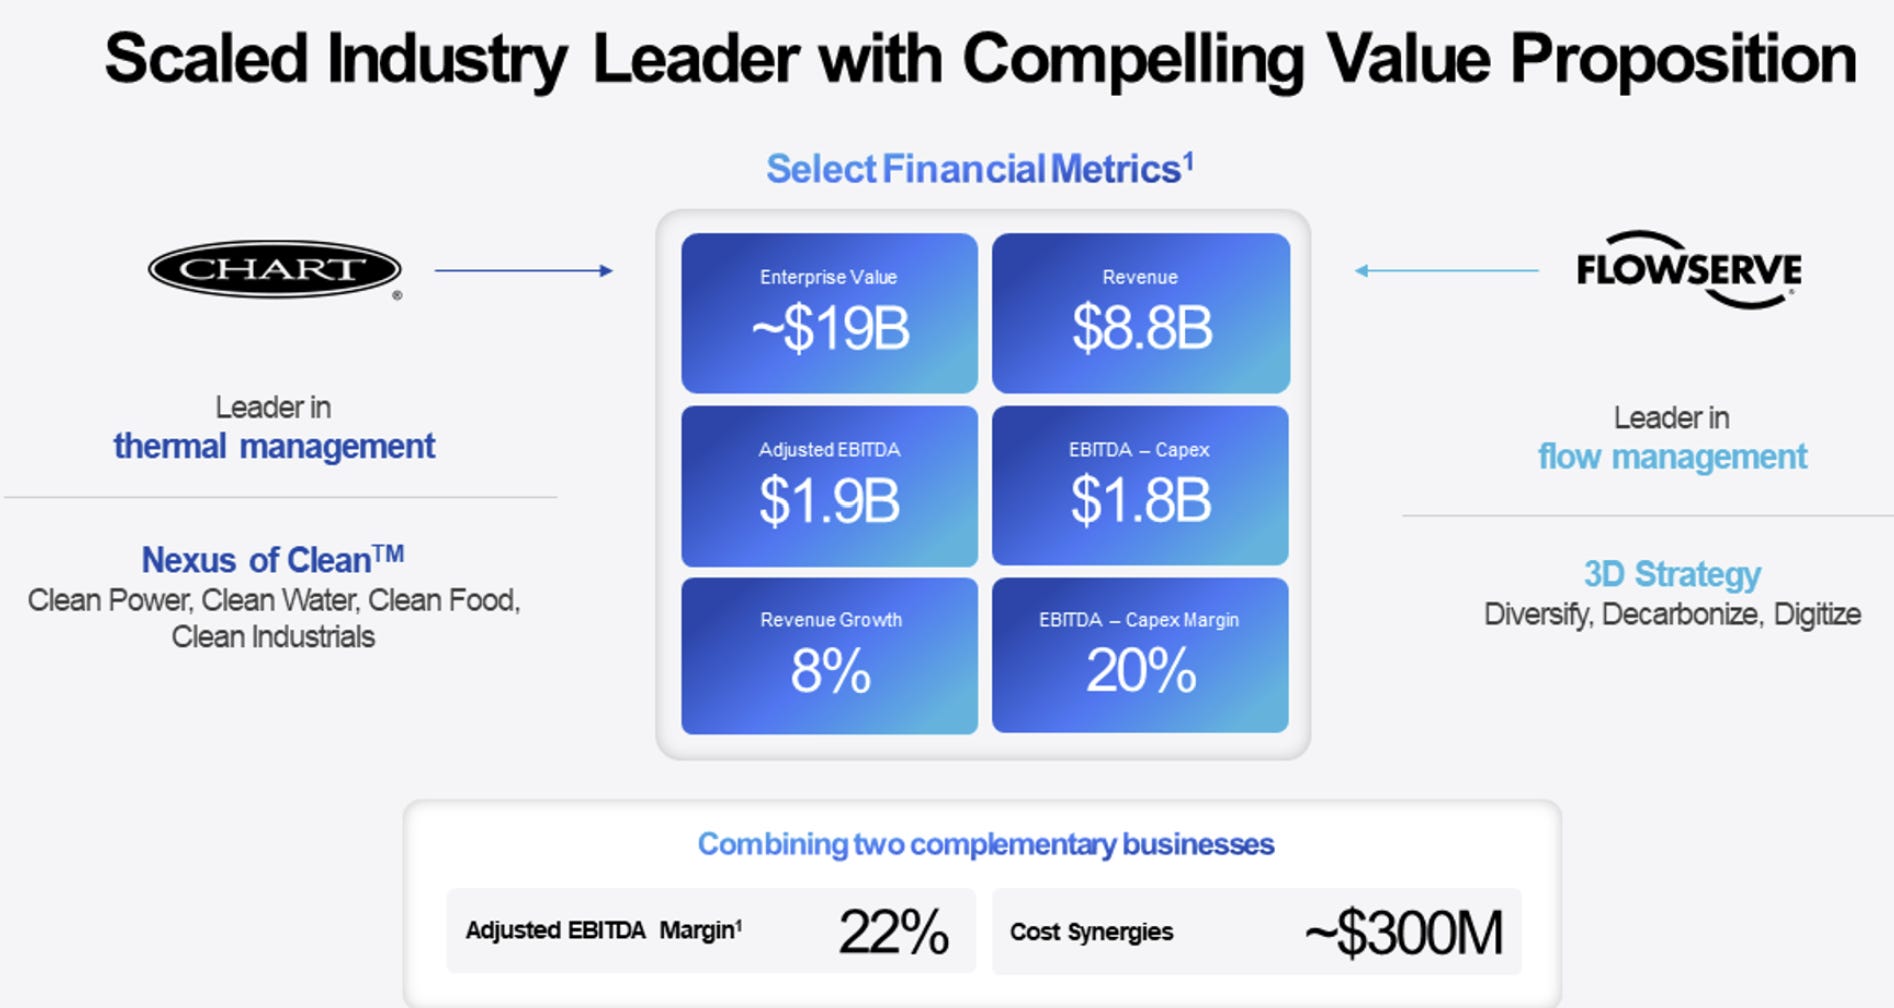
Overall, the merger makes sense. Chart makes equipment for process technology like cryogenic, compression, thermal, while Flowserve specializes in flow management. The combined company will offer both thermal and flow management solutions for gases and liquids, enabling it to fully serve a range of energy end markets including LNG, nuclear, and power generation.
One example of synergies is through Chart’s IPSMR process technology, which is used in gas liquefaction. Flowserve can immediately begin selling its valves and pumps to major LNG projects that Chart is involved in, alongside Chart’s mission-critical equipment such as air coolers, compressors, and brazed aluminum heat exchangers
Another example: RedRaven is Flow’s IOT based monitoring system used to monitor Flow’s products and they believe Ventsim and RedRaven can work together well and generate more subscription revenue from servicing a broader asset base. It’ll be the first integrated software solution used for monitoring throughout the value chain. The combined company will position them as peers to Ingersoll Rand or Dover and a leader in that market.
One objection that is legitimate is the worry that Flow’s margins are lower. Flow’s OPM have been 8% and 10% in the last years and they are on a journey of margin improvement. However they are still lower than Chart’s OPM of 11.6% and 15.6% in the last 2 years. The difference in GM is less, around 2% and Flow is working on improving their margins.
Valuation
STANDALONE
On a standalone basis, Chart Industries looks undervalued using modest assumptions. Currently the biggest risk is their high debt levels with 50% of their capital made up of debt and their interest costs are quite high at 8.7%. However, simply using the current EV/EBITDA of 11.3 and FY25 guidance EBITDA of around $1.2B we get an undervaluation of more than 30%.
Flowserve on the other hand looks slightly less undervalued. EV/EBITDA is a good multiple to use because of the differing debt levels of both companies. Flow have $4.6B in revenues, but with lower OPM of 11%+. They haven’t seen as high revenue growth as Chart but Flow’s revenues are still higher by $400M. Also, they are focused on margin improvement and they have low debt (Flow have around $1.5B in debt and $540M cash). Flow is currently valued close to $6.8B, while Chart is valued around $7.3B. This explains the 53.5% - 46.5% merger.
However, the risk is if Chart is significantly undervalued or Flowserve is significantly overvalued, an all-stock merger is not considered ideal for Chart shareholders as Chart will be using its more expensive stock to buy the less expensive Flow stock.
SYNERGIES
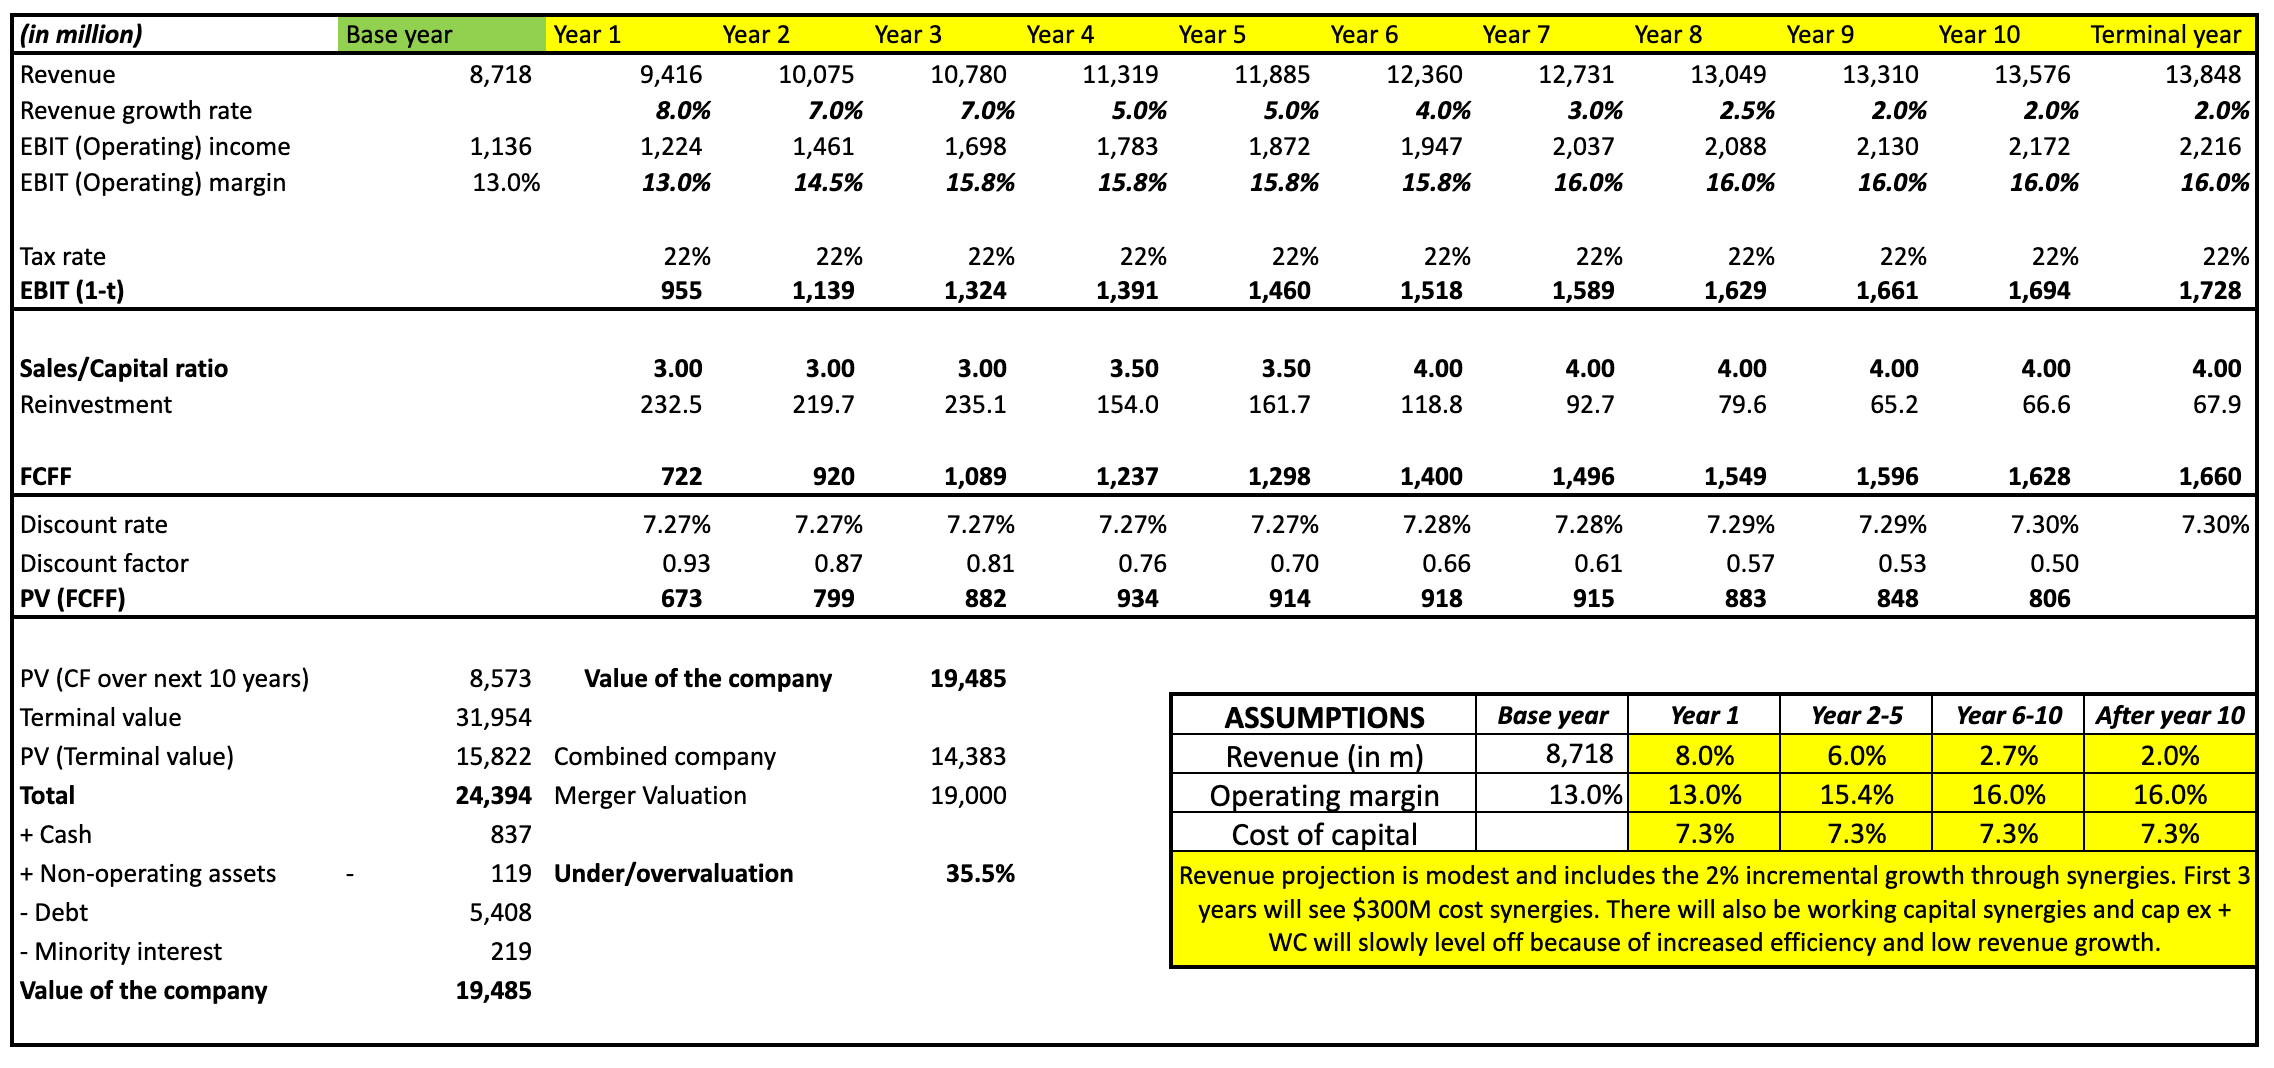
The synergies primarily stem from two sources: cost synergies driven by margin expansion, and revenue synergies from cross-selling opportunities. Revenue synergies are expected to contribute an incremental 2%, while cost synergies are projected to total $300 million, fully realized by the end of year three.
To calculate revenue synergies, we will take 2% of $8.7B (2% revenue synergies from the combined company’s revenue) with a combined company operating margin of 14% and discount it using the combined company WACC of 7.5%. We get $400M of value-added from revenue synergies.
Cost synergies will be $300M but they will be fully achieved from year 3 onwards. We take $300M discount it using the combined company WACC (= 300 / 0.075) and further discount it back 3 years. Total added value from cost savings would be slightly more than $3.5B so total synergies would be valued at around $3.9B.
COMBINED COMPANY
Post-merger cost synergies in first 3 years will drive margin improvements, alongside Flow’s target to improve margins (for their own products). Margin improvement can come in various ways as discussed – improvement in SG&A expenses (eliminating overlap) and further exploring aftermarket services which is a high margin business.
Revenue synergies are expected to drive a 2% increase in sales, primarily through cross-selling opportunities, as both companies share significant overlap in their target customer base. Furthermore, the combined company will have a healthier debt ratio and lower interest costs, which will decrease their WACC. The company also expects synergies in working capital by streamlining and managing procurement better.
Chart’s CEO noted that these synergies represent baseline targets for the next three years, with significant potential for upside. Our assumptions are conservative—for instance, we assume that the WACC remains unchanged. However, if the company chooses to reduce its debt, it could lower the WACC, which will present significant upside. Additionally, we assume a tax rate slightly above the U.S. corporate tax rate, reflecting the historically higher effective tax rates of both companies. In doing so, we see the company as significantly undervalued by a 35.5% degree:
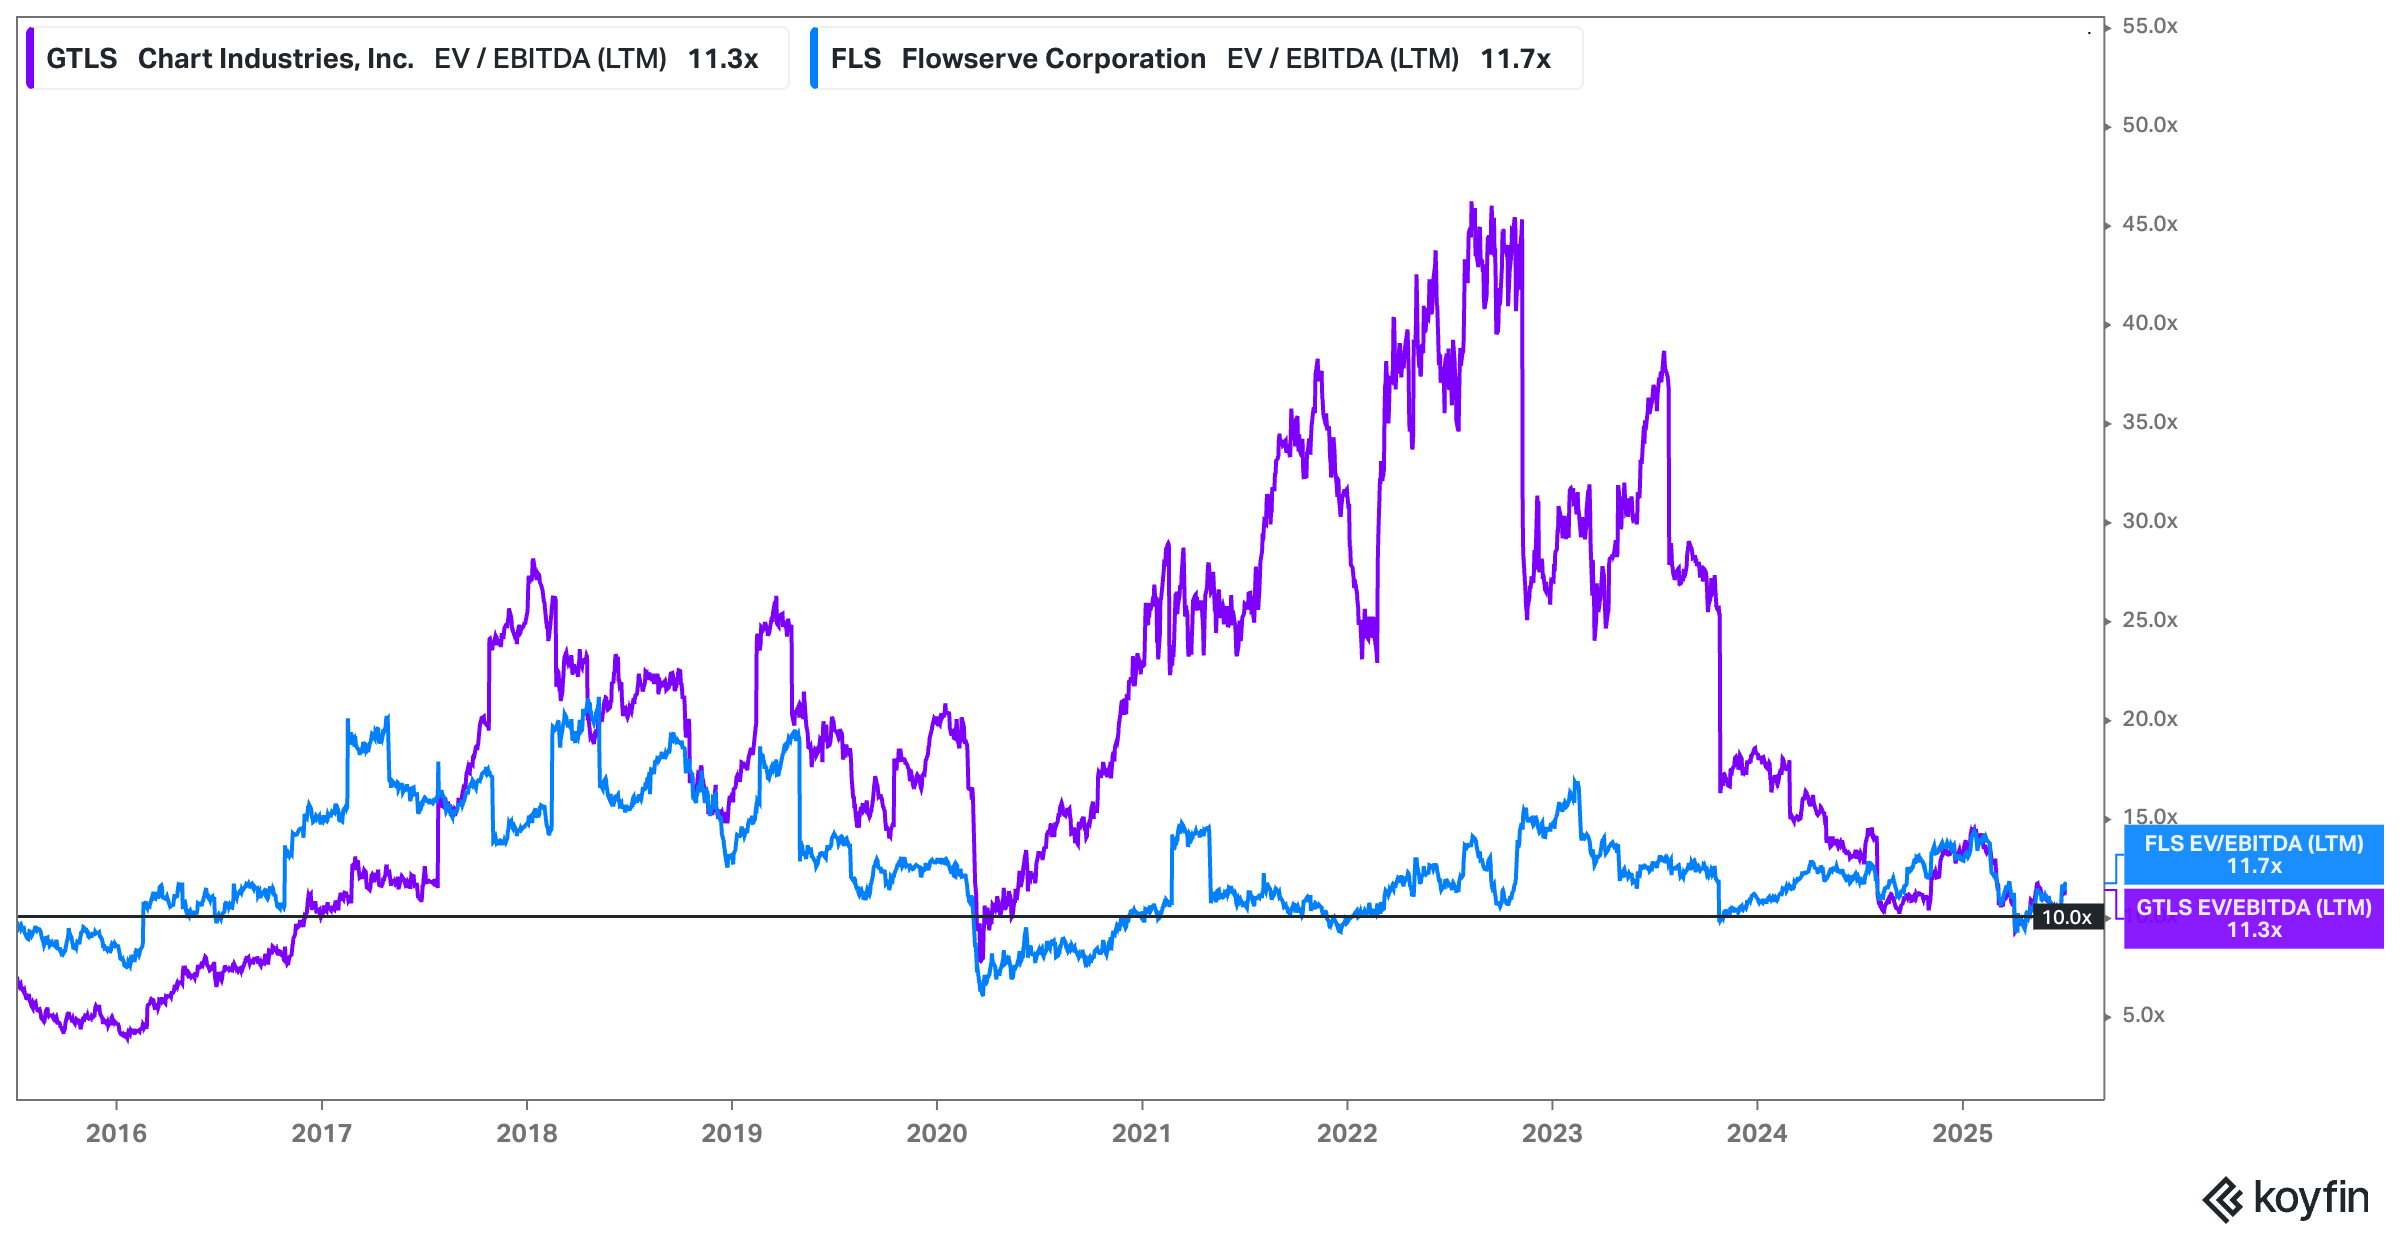
Additionally, on an EV/EBITDA basis, the combined company indicates a valuation of 10x. ($19 billion divided by the $1.9 billion expected EBITDA provided by the post-merger guidance). That multiple is sharply lower than historical multiples for both Chart Industries and Flowserve.
Conclusion
Chart was already cheap pre-merger and this merger is positive for them as there are significant synergies they can achieve through cross-selling and margin improvements. We believe the market is yet to price in the synergies from this merger.
The increased visibility following the merger could act as a catalyst for the stock price in the next few months, while successful execution of the merger positions the company for strong long-term growth and the potential to become a multi-bagger over time. Positive reports from analysts like Jefferies should also help in this regard.
Thank you for reading Overlooked Alpha.
If you enjoyed this analysis please help us by clicking the “♡ Like” button.
Disclaimer: The information in this newsletter is not and should not be construed as investment advice. Overlooked Alpha is for information, entertainment purposes only. Contributors are not registered financial advisors and do not purport to tell or recommend which securities customers should buy or sell for themselves. We strive to provide accurate analysis but mistakes and errors do occur. No warranty is made to the accuracy, completeness or correctness of the information provided. The information in the publication may become outdated and there is no obligation to update any such information. Past performance is not a guide to future performance, future returns are not guaranteed, and a loss of original capital may occur. Contributors may hold or acquire securities covered in this publication, and may purchase or sell such securities at any time, including security positions that are inconsistent or contrary to positions mentioned in this publication, all without prior notice to any of the subscribers to this publication. Investors should make their own decisions regarding the prospects of any company discussed herein based on such investors’ own review of publicly available information and should not rely on the information contained herein.