
I wrote the following passage back in August 2020:
For about two decades, I bristled any time comparisons were made to the dot-com bubble of the late 1990's. After all, I saw the bubble in real-time. Based on that direct experience, any comparisons to 1999 significantly understated the insanity that permeated the market of that era. I don't bristle any more, or at least not quite to the same extent. The craziness of [this] market isn't as broad, or as intense, as that seen in the late 1990s. But this market certainly has echoes of that bubble. We're seeing some of the same trends and, more importantly, many of the same mistakes. It's more reasonable to compare the current market to 1999/early 2000 than it's been in the last two decades. And so if history repeats, there seems a real chance for a significant drawdown in U.S. stocks, even if that drawdown is unlikely to match the staggering value destruction seen in 2000-2002. It's worth repeating: this isn't 1999. But at least as far as the equity markets go, we're as close as we've been since then.
And even though the next six months were particularly crazy, I still believe the point holds up.
Outside of the SPAC boom (and the crypto bubble), most of the biggest growth winners of 2020-2021 were at least real businesses. As I noted in that piece, anyone (say, David Einhorn) comparing Chewy (CHWY) to Pets.com should remember that Pets.com generated only about $5.8 million in revenue during its last year — with the “about” in there because the company went bankrupt so fast it literally had to estimate its sales. Chewy has generated almost $9 billion in sales over its past four quarters.
And so I don’t believe we’ll see quite the epic value destruction we saw after the 2000 peak. But, increasingly, it does look like we’re seeing a repeat in kind, if not quite degree. The 2000 sell-off was driven by the market’s sudden realization of just how ridiculous valuations had become. The 2021/20221 iteration seems the same.
In both cases, anticipated tightening from the Fed appeared to be a key, and maybe the key, catalyst of the sudden return to fundamental focus. In both cases, housing values had soared alongside equity prices to potentially unsustainable levels. In 2001, the US economy entered a recession; predictions for a 2023 recession are becoming close to consensus.
At the very least, 2022 looks like 2000 far more than it does 2007. In that latter case, valuations became stretched, certainly. But it certainly seems like the bigger error there was the failure to anticipate the housing crisis, and more generally the extrapolation of bullish macro trends forward in perpetuity. (There’s been some of that this time around, of course: bear in mind that Home Depot (HD) — an impressive business yes, but still a cyclical retailer — traded at 27x earnings at the start of the year.)
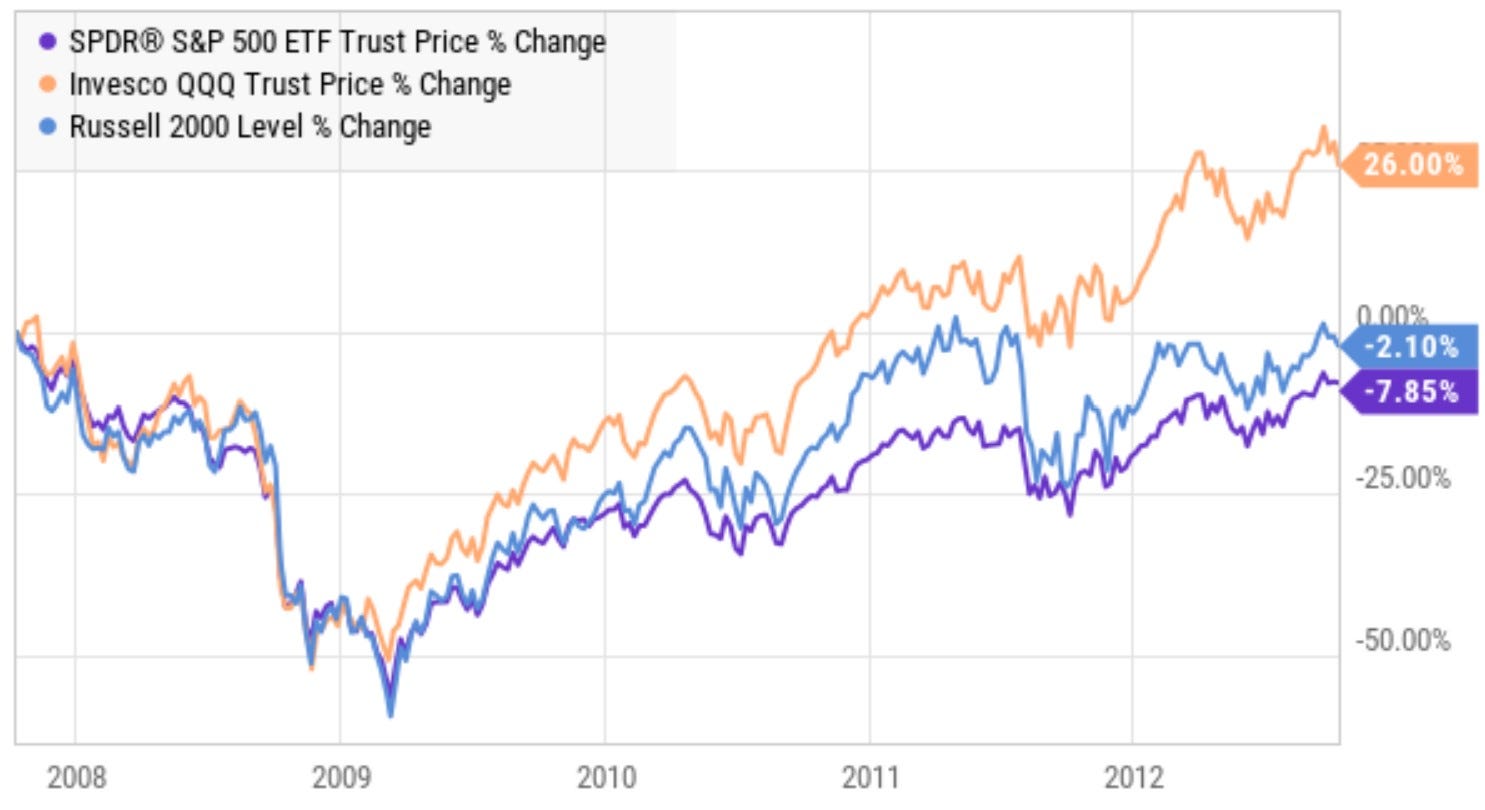
History suggests the comparison to 2000, rather than 2006/2007, is a problem for the US equity market. Here’s a five-year chart from the 2007 peak for the S&P 500 (Oct. 9 of that year):
source: YCharts
2008 was absolutely terrifying (collectively, I think we’ve somewhat forgotten how terrifying). But an investor who was early in buying — say, in late 2008 — still did pretty well reasonably fast. An investor who timed the bottom made huge profits: the Russell 2000 rallied 90% — ninety percent! — between Mar. 6, 2009 and Mar. 6, 2010. Even someone who bought stocks in early 2008, believing that whole “housing bubble” stuff was overdone, probably was made whole within 2-3 years.
Now let’s see the five-year chart from Mar. 9, 2000, the intraday peak for the NASDAQ:
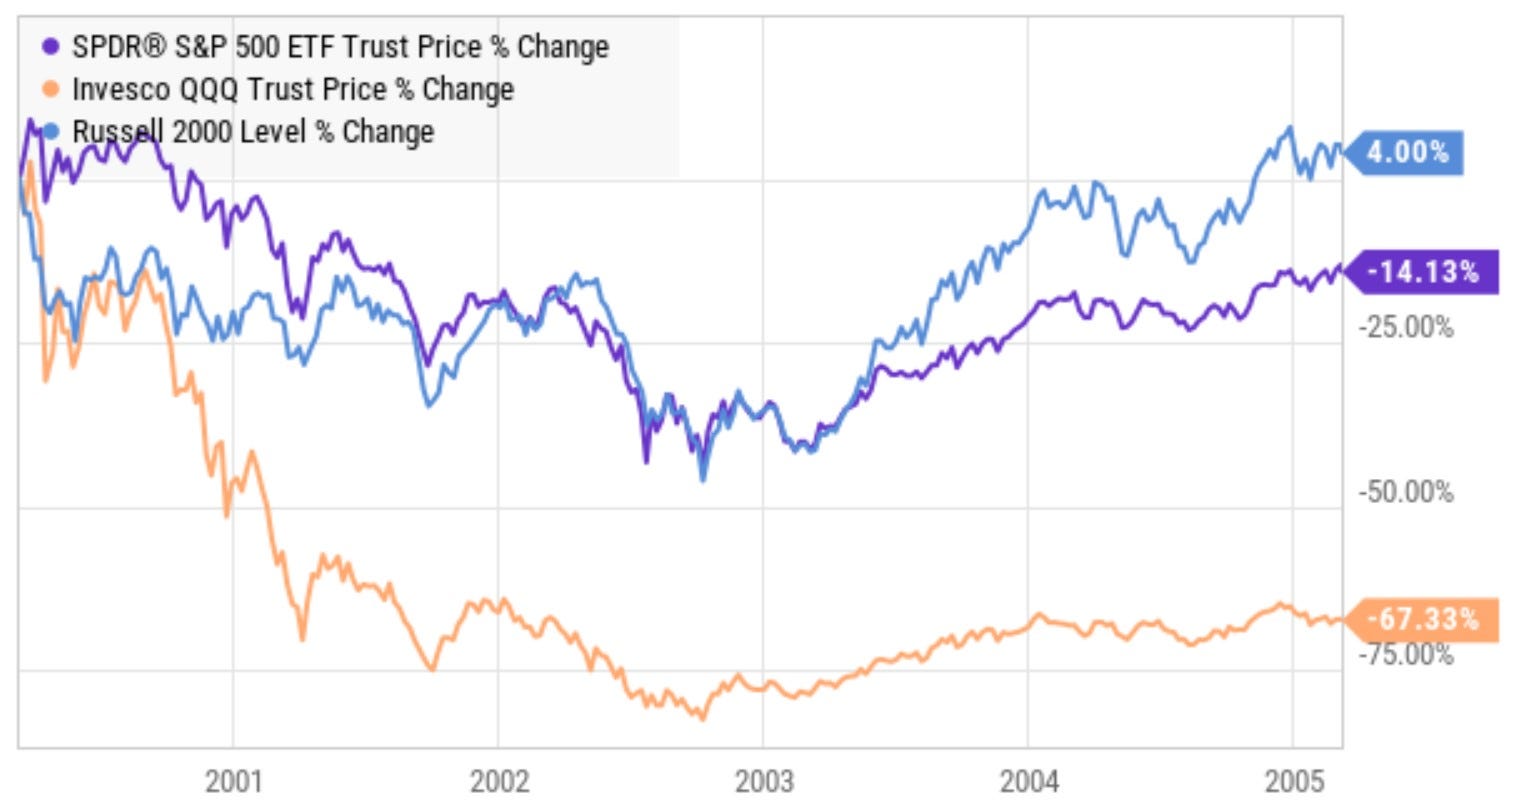
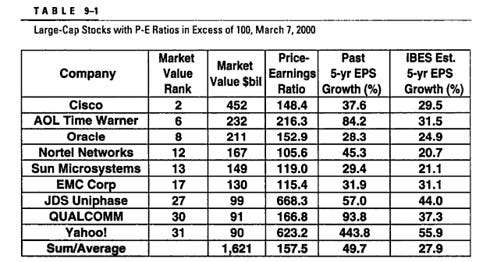
Two things stand out. The first is the unbelievable performance of the NASDAQ 100. Bear in mind that the NASDAQ then was not the NASDAQ now, an exchange on which the world’s largest companies are listed. The NASDAQ 100 at the 2000 peak had a profile far more like Ark Innovation (ARKK) today, given speculative tech’s dominance not of returns, but of actual size in the US market2:
source: Stocks For The Long Run, Jeremy Siegel
The NASDAQ 100 didn’t bottom for two and a half years. (Famously, the NASDAQ Composite took more than fifteen years to recapture its 2000 peak.) The performance of that index is one of the best representations of the dangers of anchoring bias. And it’s also a strong counter to the “you could have bought Amazon.com (AMZN) in 2001 for $18” argument; unless you picked the fallen angels exceptionally well that year, you were still going to lose money for quite a while (particularly since some of your investments were going to head to zero).
The second thing that jumps out is that the market outside of speculative tech, too, didn’t bottom for about 30 months. The S&P was nearly halved. Yes, 9/11 created losses and there was a recession that year, but that recession lasted only eight months; investors still were selling for most of the following year. And if an investor was a little early in buying, unlike in late 2008 she was probably still in the red four years later.
Again, this really feels like 2000 in much of the market. The recent performance in supposedly ‘safe’ names (Procter & Gamble (PG) being a perfect example, underperforming even our bearish call from last month) suggests that realization is spreading. There aren’t safe names in this kind of market. That’s not how it works.
And the bottom seems unlikely to be in. We made that point in our very first post here at Overlooked Alpha; our biggest mistake since has been not fully committing to that judgment. Nate Anderson at Hindenburg Research echoed our broader concern in a tweet this week:

If the bottom isn’t in, and if this is a smaller version of 2000, then we’ve got a rocky few years ahead. (The mid-1970s, following the “Nifty Fifty” boom, offer another analogue. My father started working as a broker in 1973, I believe, and the stories from those years are not much fun.) That doesn’t mean we won’t be invested, or that others shouldn’t be. It doesn’t mean that we won’t keep bringing long ideas here at Overlooked Alpha.
But it does mean that the work needs to be better, and the strategies more complex. Anyone can make money in a bull market; in fact, in the kind of bull market we just had, experience and fundamental analysis can hurt relative performance. A bear market, or even a stagnant one, requires more creativity, more strategy, and usually less of a long bias.
It’s long past time to prepare for that market. In that vein, here are a few names on our watchlist, long and short. None look worthy of big moves just yet, but depending on their performance and/or that of the market, each could provide an opportunity at some point.
Trex Holdings (TREX)
Trex makes a great product (one I’ve used), a composite used primarily for decking. The company continues to expand its offering, and more categories no doubt will follow. The international opportunity is large as well.
Fundamentally, TREX looks like a steal. EPS (split-adjusted) was 41 cents in 2015, and $2.10 (adjusted) in 2021, a 30%-plus CAGR. Adjusted EBITDA margins are ~30%. The balance sheet is clean ($115 million in cash, no debt). Yet the stock trades at ~18x 2022 Adjusted EBITDA (based on guidance), and ~23x 2023E consensus EPS.
TREX is the kind of name that fundamentally-driven investors say they will buy when it gets 20% cheaper — and it’s 54% off last year’s high. And so there’s a case to simply buy here, take the long view, and ride out any volatility with a strong company that’s positioned to keep taking market share in reasonably large end markets.
But, of course, there’s significant housing/renovation exposure here — which is a double-edged sword. ~26x 2022 EPS is attractive in the context of a 31% 5-year CAGR. It’s not great is 2022 EPS is at a cyclical peak. The free cash flow multiple is far less impressive; capex continues to significantly outpace depreciation (though, obviously from a long-term perspective the company is investing behind growth).
TREX just seems like the epitome of so many quality publicly traded companies. The stock is down big short-term, and thus would seem like a long-term opportunity — but as an investor dives deeper and deeper, the case for the stock being compelling right now gets weaker and weaker. We have no idea precisely what this housing market is going to look like: we’re bullish mid-term, owing to the housing shortage we noted this month, but one does wonder if the demographic shift driven by remote work is at its end, removing the incredible leverage sellers (and builders) have had for the last two years.
I like TREX. I don’t love it. That might change.
Aaron’s (AAN)
Man, is there a case to be made for Aaron’s right here. The rent-to-own operator historically has been a countercyclical business. Same-store sales grew 3.1% in 2008, 8.1% in 2009, 3.5% in 2010. The intense pressure coming for Buy Now Pay Later providers, as well as “virtual RTO” players like PROG Holdings (PROG), from which Aaron’s was spun in December 2020, should improve Aaron’s competitive environment.
The stock is cheap, at less than 7x adjusted EPS guidance for this year. Aaron’s is buying back shares at a big clip, repurchasing ~10% of shares outstanding in 2021 alone. That activity slowed in Q1 as the company bought retailer BrandsMart for $230 million, but there’s still room to use free cash flow to continue reducing the float.
But that case actually highlights two key risks here. The first is precisely that acquisition. Every value investor on Earth knows the biggest impediment to realizing paper value is that executives almost always believe they are better at investing the company’s cash flow than their shareholders.
BrandSmart — ten retail locations in Florida and Georgia plus an e-commerce business — looks potentially like the first step of an appliance retail roll-up. And the $230M price represents almost 40% of Aaron’s current market cap, while also adding some leverage to the balance sheet (admittedly, a little over 0.5x 2022 Adjusted EBITDA guidance).
The acquisition also highlights the second concern: is competition really going to lessen? Rangeley Capital’s Andrew Walker in December highlighted the argument that PROG’s Progressive Finance and its rivals will at some point simply devour Aaron’s and Rent-A-Center (RCII). The financing is the same between Progressive and Aaron’s. The inventory available to be purchased at Best Buy (BBY) via a Progressive RTO is better and more varied — and the ultimate price is likely cheaper as well.
At a ridiculous price, those risks start to get priced in. Big early results from BrandSmart could change the case as well.
To be fair, the bull/bear debate over AAN isn’t really about the cycle, or the market. At its heart, it’s the classic “value play or value trap?” argument. Without BrandSmart, it’d be easier to make the “value play” case. With it, and with the competitive risks, again it’s tough to see the stock as compelling right now.
Joby Aviation (JOBY)
JOBY stock is up 6.7% Thursday as of this writing because the air taxi operator received Part 135 certification from the Federal Aviation Authority.
This was no surprise. Joby’s head of air operations said on the Q2 call two weeks ago that the certification would arrive relatively soon. The discussion perhaps didn’t suggest it would arrive quite this quickly, but there isn’t anything in the news to suggest a ~$200 million increase in the company’s market cap.
These are the kinds of moves we saw in 2020 and 2021 in these kinds of stocks: 20% gains based on factories opening or electric vehicle production beginning. Clearly, we’re still seeing them, though as in JOBY’s case they’re usually smaller.
We won’t bottom until those moves stop. But, in the meantime, investors should think about watching carefully for these gains. Again, look at the NASDAQ 100 chart post-March 2000. For years, every gain reversed.
The same trend is likely going to hold for so many of the most speculative stocks in this market, too. (Bear in mind that Joby still has a market cap around $3.5 billion.) As long as retail investors are buying stocks based on inconsequential milestones, there are going to be opportunities to scalp those stocks. That’s a good way to balance the portfolio and find some returns even if broader indices aren’t necessarily cooperating.
Integral Ad Science (IAS) / Digital Media Solutions (DMS) / AdTheorent (ADTH)
It would seem, at least from social media, that Facebook (FB) and Alphabet (GOOG) (GOOGL) are no-brainer winners here, purely victims of a panicked market.
That may be true. But there is a catch. If the panicked market is selling indiscriminately, why buy those two names? Why not look elsewhere in the online advertising space?
Indeed, we’ve already done so with AppLovin (APP), our first long idea (and my largest position). But the entire space has some really interesting names for investors who believe a) that long-term growth is going to be fine and/or b) that cyclical worries (in the space or the market more broadly) are overblown.
We’ll probably talk more about the group down the line (likely in a future Research Notes), but there are a number of intriguing bull cases. IAS focuses on digital trust, a growing necessity in the wake of privacy changes from Apple (AAPL). There’s a connected TV angle to play as well.
The stock went public at $18 only last year (and in late June); it’s now below $12. Q1 results were solid: IAS actually gained 8%-plus after the report. Valuation is reasonable at ~16x this year’s Adjusted EBITDA guidance.
AdTheorent is a de-SPAC that’s actually traded well. Just below $9, it’s a multi-bagger by de-SPAC standards (we highlighted the carnage in that category two weeks ago). The company’s model — using machine learning to optimize programmatic ad campaigns — might get a boost in tougher times, as companies look to maximize every dollar of advertising spend. Longer-term, programmatic’s steady march should provide a tailwind.
Valuation here isn’t notably attractive (~30x this year’s EBITDA), but like IAS AdTheorent had a solid Q1, reaffirming guidance. And, again, it’s a de-SPAC trading near $9 (and up from $4 earlier this year); there’s probably something to the relative strength here against other de-SPACs and ad-dependent plays.
DMS, another de-SPAC (albeit a 2020 vintage), is the highest-risk of the group. The balance sheet now is levered 4x-plus, and the company has some insurance market exposure which seems like a near-term problem. But EV/EBITDA is ~6x based on guidance, DMS has a decent first-party database (again, an asset in the new privacy environment), and ~flattish expectations for growth this year suggest the company might be able to muddle through.
This is probably the lowest-quality business of the three (and potentially in the space), but that alone doesn’t mean the equity here gets zeroed. This is probably a zero or a double (at least) in the mid-term.
DMS in turn highlights a broader point, one that absolutely must be kept in mind over the next few months (and, if our initial discussion is on point, potentially the next few years). Big sell-offs are not necessarily the time to buy “quality”, as so many pundits will tell you. March 2020 and March 2009 were the times to buy risk.
Obviously, individual portfolio considerations put guardrails on that broad lesson. But as investors look for value here, they still should keep that lesson in mind. FB and GOOGL indeed probably do well over the long haul (though FB still looks dicey to my eye). And it’s nerve-wracking to own a name like IAS in an environment where Snap (SNAP) can (probably) execute poorly and bring down the entire sector.
But the real winners can be found in precisely these kinds of names. Picking the right one(s) is not an easy task, certainly. Still, that’s at least where investors should be looking, and likely where we will spend a good deal of time over the next few months.
As of this writing, Vince Martin is long shares of AppLovin.
Disclaimer: The information in this newsletter is not and should not be construed as investment advice. Overlooked Alpha is for information, entertainment purposes only. Contributors are not registered financial advisors and do not purport to tell or recommend which securities customers should buy or sell for themselves. We strive to provide accurate analysis but mistakes and errors do occur. No warranty is made to the accuracy, completeness or correctness of the information provided. The information in the publication may become outdated and there is no obligation to update any such information. Past performance is not a guide to future performance, future returns are not guaranteed, and a loss of original capital may occur. Contributors may hold or acquire securities covered in this publication, and may purchase or sell such securities at any time, including security positions that are inconsistent or contrary to positions mentioned in this publication, all without prior notice to any of the subscribers to this publication. Investors should make their own decisions regarding the prospects of any company discussed herein based on such investors’ own review of publicly available information and should not rely on the information contained herein.
Unlike 2000, there’s been a waterfall element to this sell-off. SPACs and the like turned back in February of last year; more established growth stocks toward the end of the summer; large-caps this year. Bear in mind that Apple (AAPL) on Mar. 30 was less than 4% off its all-time high.
This is another piece of evidence showing how spurious any comparisons to 2000 actually are. Imagine, say, QuantumScape (QS), DraftKings (DKNG), and Lucid Motors (LCID) being in the top 10 in market capitalization in February 2021.