
Highlights:
We review four long recommendations that have struggled in recent weeks.
COHR has actually kept pace with the market since April, but with enormous volatility. Investors are swinging between cyclical concerns and secular optimism.
FTCH is now our worst pick ever — but we’re not yet willing to give up on a complicated story.
Accuray’s turnaround continues, but a big rally and a leveraged balance sheet suggest some caution from this point on.
We’re sticking with our March thesis on Charles Schwab, though the market’s reaction of late is worth respecting.
It may have been writing “It feels like a quiet earnings season” with the fate-tempting title “Earnings We Got Right”. Or it might just be that investing is hard. Whatever the cause, we’ve seen a few of our past recommendations take a dive toward the end of this earnings season.
Certainly, we’re not happy about these moves. But our overall performance remains solid. And so in the interest of taking responsibility and seeing if these declines might prove buying opportunities, we want to take some time and review a few recommendations that, in recent weeks, have gone in the wrong direction.
The Coherent Roller-Coaster
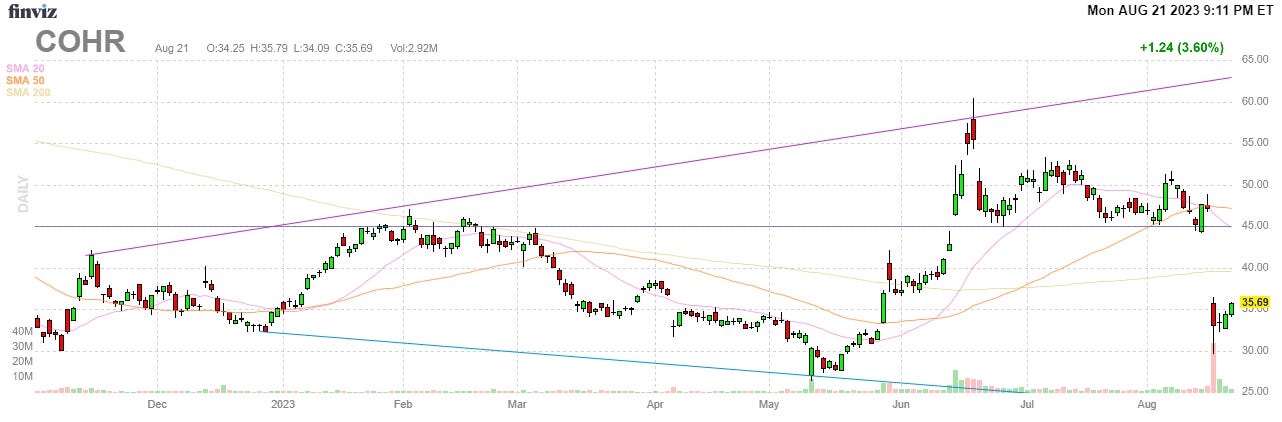
Semiconductor and networking supplier Coherent COHR 0.00%↑ is up 6.2% since we recommended the stock back in mid-April, lagging the S&P 500 Total Return by less than one percentage point. But those nominal gains have required quite a ride:
source: finviz.com
The volatility has been driven largely by a tug-of-war between what is happening this year and what is going to happen in the future.
Our April bull case had pillars from both timeframes. In the near term, we argued that pre-announced fiscal Q3 results by networking peer Lumentum LITE 0.00%↑ had caused an unjustified sell-off in COHR. Given that Coherent hadn’t provided a similar warning, the risk to its earnings appeared lower than the market seemed to believe.
Meanwhile, taking the longer view, such cyclical worries appeared short-sighted when accounting for tailwinds from electric vehicles, cloud computing, and other secular trends.
As it turned out, Coherent’s FQ3/CQ1 results, delivered on May 10, were disappointing, just as the market had feared. Adjusted EPS for the quarter was $0.58, $0.24 below analyst consensus. Guidance for fiscal Q4 was even worse: a range of $0.33-$0.43 against an average Street estimate of $0.86. COHR dropped 13% over the next three trading sessions. Two days later, the stock closed at a three-year low.
Incredibly, over the next five weeks, COHR doubled1. That rally came as investors pivoted to the long view. Coherent’s 800G transceivers seemed likely to benefit from the generative artificial intelligence trend, which would require continuing buildout of genAI-focused architectures that use those transceivers.
But the latest earnings report has ended the party again. The fiscal Q4 report itself was not that bad relative to post-Q3 guidance. But the outlook for FY24, on its face, looks disastrous. Street estimates for the year has already been lowered after Coherent first cited cyclical pressures, but Coherent’s outlook still whiffed, coming in at $1.00-$1.50 for full-year adjusted EPS against consensus of $2.95. COHR plunged 30% on the release, though it’s bounced a little over 8% in the two sessions since.
Take The Long View…Right?
It’s tempting to argue that investors should simply stay the course here. It does not appear that either the disappointments of the last two quarters impact the long-term trend at all. On the Q4 conference call, management spoke positively of the multi-year AI-driven opportunity in transceivers. Elsewhere in the market, optimism towards that opportunity remains obviously intact: Applied Optoelectronics AAOI 0.00%↑ is up 803% (eight hundred and three percent!) over the past three months.
And it’s not just AI. Coherent is guiding for 40%-plus growth in silicon carbide substrates, used to make chips for electric vehicles. The laser portfolio can further benefit from that trend, as Coherent products are used to weld EV batteries. The OLED display market should have a solid year. All told, the same trends Coherent has called out for some time remain intact, and so does Coherent’s ability to capitalize on those trends:

source: II-VI/Coherent merger presentation, March 2021
The problem seems to be cyclical demand. In that context, the disappointing FY24 outlook simply doesn’t matter that much. And while COHR might ‘sound’ somewhat expensive at nearly 30x the midpoint of the adjusted EPS range, that performance seems to be coming at a cyclical bottom, which is when long-term investors should be expanding the target multiple.
This seems like a situation where the wise thing for a long-term investor to do is to actually be a long-term investor. Ride out the cycle, and benefit when the market’s attention starts turning toward a potentially explosive improvement in performance as cyclical and secular tailwinds combine, hopefully at some point next year.
And yet…after the last two quarters, that’s much easier said than done. The burst of generative AI optimism that led COHR to double seems unlikely to return. Without improved investor sentiment, it’s hard to see a catalyst until maybe fiscal Q2 earnings next February.
Again, our case in April had two pillars, one short-term and one long-term. With that short-term pillar gone, it’s difficult to pound the table quite as forcefully.
Farfetch Is Complicated
Online luxury platform Farfetch FTCH 0.00%↑ now has the distinction of being the worst call we’ve made to this point: shares are down 66% since our recommendation back in May 2022. That includes a 45% decline on Friday to an all-time low.
It would seem like the cause of the decline is simple, since on its face Farfetch is a reasonably simple business: an online luxury retailer.
That’s not actually the case, however. Sell-side analysts at Wedbush, who get paid to understand Farfetch, struggle to do so:
FTCH remains an extremely challenging business to wrap one’s head around, with highly-volatile fundamentals and one of the most confusing models in our space (both the business model and the financial model).
While there is an intriguing long-term growth opportunity here, the trajectory of the business is very hard to gauge…
Farfetch’s ‘core’ business is operating a platform for luxury brands such as Prada, Kering, and Richemont. But Farfetch also generates fulfillment revenue on some of those sales. It owns brands including Stadium Goods, Violet Grey, and Browns, and New Guards, the latter of which itself is a group of ten brands. Some of that revenue is booked as first-party direct revenue, other sales are categorized as “Brand Platform”, which also includes revenue from a touted (and so far disappointing) partnership with Reebok.

source: Farfetch 20-F
To make it even more complicated, the China operations operate under a joint venture with a put/call option that triggers under varying circumstances, and the pending acquisition of YOOX Net-A-Porter will have a similar structure. So while on its face, Farfetch has an enterprise value just shy of $2 billion (fully diluted market cap over ~$1.4B, net debt of $460 million), that figure doesn’t include an 11% stake being swapped for 47.5% ownership in YNAP, and may change depending on how the JVs play out.
And that’s just the financial structure. The last few years, unsurprisingly, have seen substantial volatility in the external environment. Currency alone hit revenue growth in 2022 by nine full percentage points. Until last year, Russia was the company’s third-largest market. China saw extended COVID lockdowns last year and a weak rebound so far this year for both Farfetch and other players in the space.
FTCH Gets Volatile
In that context, the enormous volatility in Farfetch stock, particularly after earnings reports, is not terribly surprising. When investors are guessing at what is happening right now, let alone in the future, they’re likely to overreact to whatever concrete data points they actually get.
Coming out of Q2, with FTCH just off an all-time low, the consensus opinion seems to be that this business simply isn’t working. It’s not hard to see why. 2023 guidance suggests high-single-digit revenue growth (and even that outlook appears potentially aggressive). Both Adjusted EBITDA and free cash flow margins are guided barely positive; but both exclude share-based compensation, which is running at ~7% of revenue.
Even before 2023, the skeptical argument toward FTCH was that the best luxury companies wouldn’t cede control over pricing and distribution. That argument seems to be playing out. Consulting firm Bain, in a 2022 year-end review, said so-called “monobrand” websites had 45% share last year. That was up sharply from 30% in 2019. Within the multi-brand universe, MyTheresa MYTE 0.00%↑ seems to be taking some market share (its revenue growth this year should be faster, as was the case in 2022), adding another challenge.
The soft Q2 (including a huge whiff on revenue) and guidance for a second straight year of muted top-line growth show the fundamental impact of those challenges. And they seem to justify Friday’s plunge and FTCH’s move to an all-time low.
And yet, the previous two quarterly reports actually saw Farfetch stock jump, with an 11.3% gain after the Q4 release in February and a 14.8% rally following Q1 in May. In both cases, the outlook for 2023 was stronger, but in both cases the news coming out of China, in particular, was not nearly as negative.
With FTCH now trading at less than 1x revenue and roughly 2x gross profit, it’s not difficult to be a little tempted here. The China JV valued the company’s operations in the market alone in the range of $1.5 billion. Farfetch has also invested $200 million in high end retailer Neiman Marcus. The lower stock price means a lower price is locked in for the YNAP deal. There’s probably a niche Farfetch can find somewhere in the luxury space, and it’s not as if the business is in decline (yet).
Admittedly, that’s a qualitative and somewhat shaky bull case — but right now, that’s about the only bull case an investor can make.
Accuray
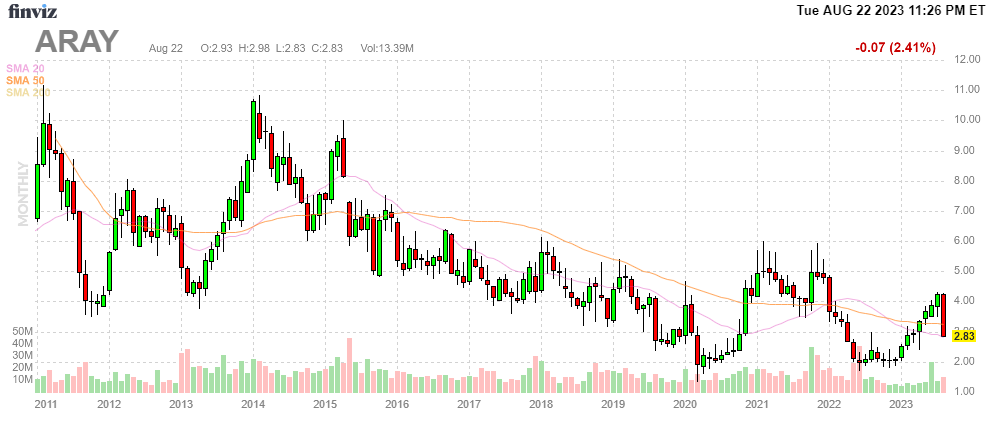
When we recommended Accuray ARAY 0.00%↑ , a maker of radiosurgery and radiation therapy equipment, ARAY stock didn’t look like much. Excluding a three-week stretch during the worst of March 2020 trading, the stock was three cents above an all-time low. Revenue growth was modest and valuation was not attractive.
But we argued last June that there was more to ARAY than met the eye. An operational turnaround plus improving utilization in the post-pandemic environment suggested a path to strong upside. For some time, ARAY delivered. Less than a month ago, shares had gained 133% and moved to an 18-month high.
Unfortunately we held that position over the latest Fiscal Q4 earnings. ARAY fell 23% in two sessions after the report; shares are now down 34% in just over three weeks.
In this case, the market seems to have it right. The problem is that ARAY still doesn’t look like much. At the midpoint of fiscal 2024 guidance, the stock trades at about 13x Adjusted EBITDA. The outlook implies a revenue increase of just 3% to 5%, following a 4% increase in FY23, which undercuts hopes for accelerating growth thanks to external or internal improvements. Net leverage is over 3x, which means the stock can absolutely tank if the company stumbles at all in the coming quarters.
Last year’s lows were created by a no-news sell-off that seemed driven by broad market weakness rather than any real change in the outlook for the Accuray business. The sell-off of the last three weeks, however, appears to have a legitimate catalyst.
source: finviz.com
At the lows, there was real logic to betting on Accuray breaking its multi-year trend. Down from the highs, that risk: reward isn’t nearly as compelling. We’ll close ARAY out on our performance spreadsheet as well.
Charles Schwab: Assets Versus Earnings
When we recommended Charles Schwab SCHW 0.00%↑ in mid-March, the stock had plunged 24%. The catalyst, of course, was the failure of Silicon Valley Bank, which led to a rout in financials across the market.
The story was (and still is) complex, but a key pillar of our case was that investors were focused on the wrong thing. SVB’s failure brought home the risk of mark-to-market losses in long-term government bonds, losses created by the rapid series of interest rate hikes by the Federal Reserve. Owing to an accounting treatment, Schwab was able to essentially obscure those MTM losses. Bears at the time argued that, adjusted for the actual market value of its bond portfolio, Schwab’s equity was negative or close.
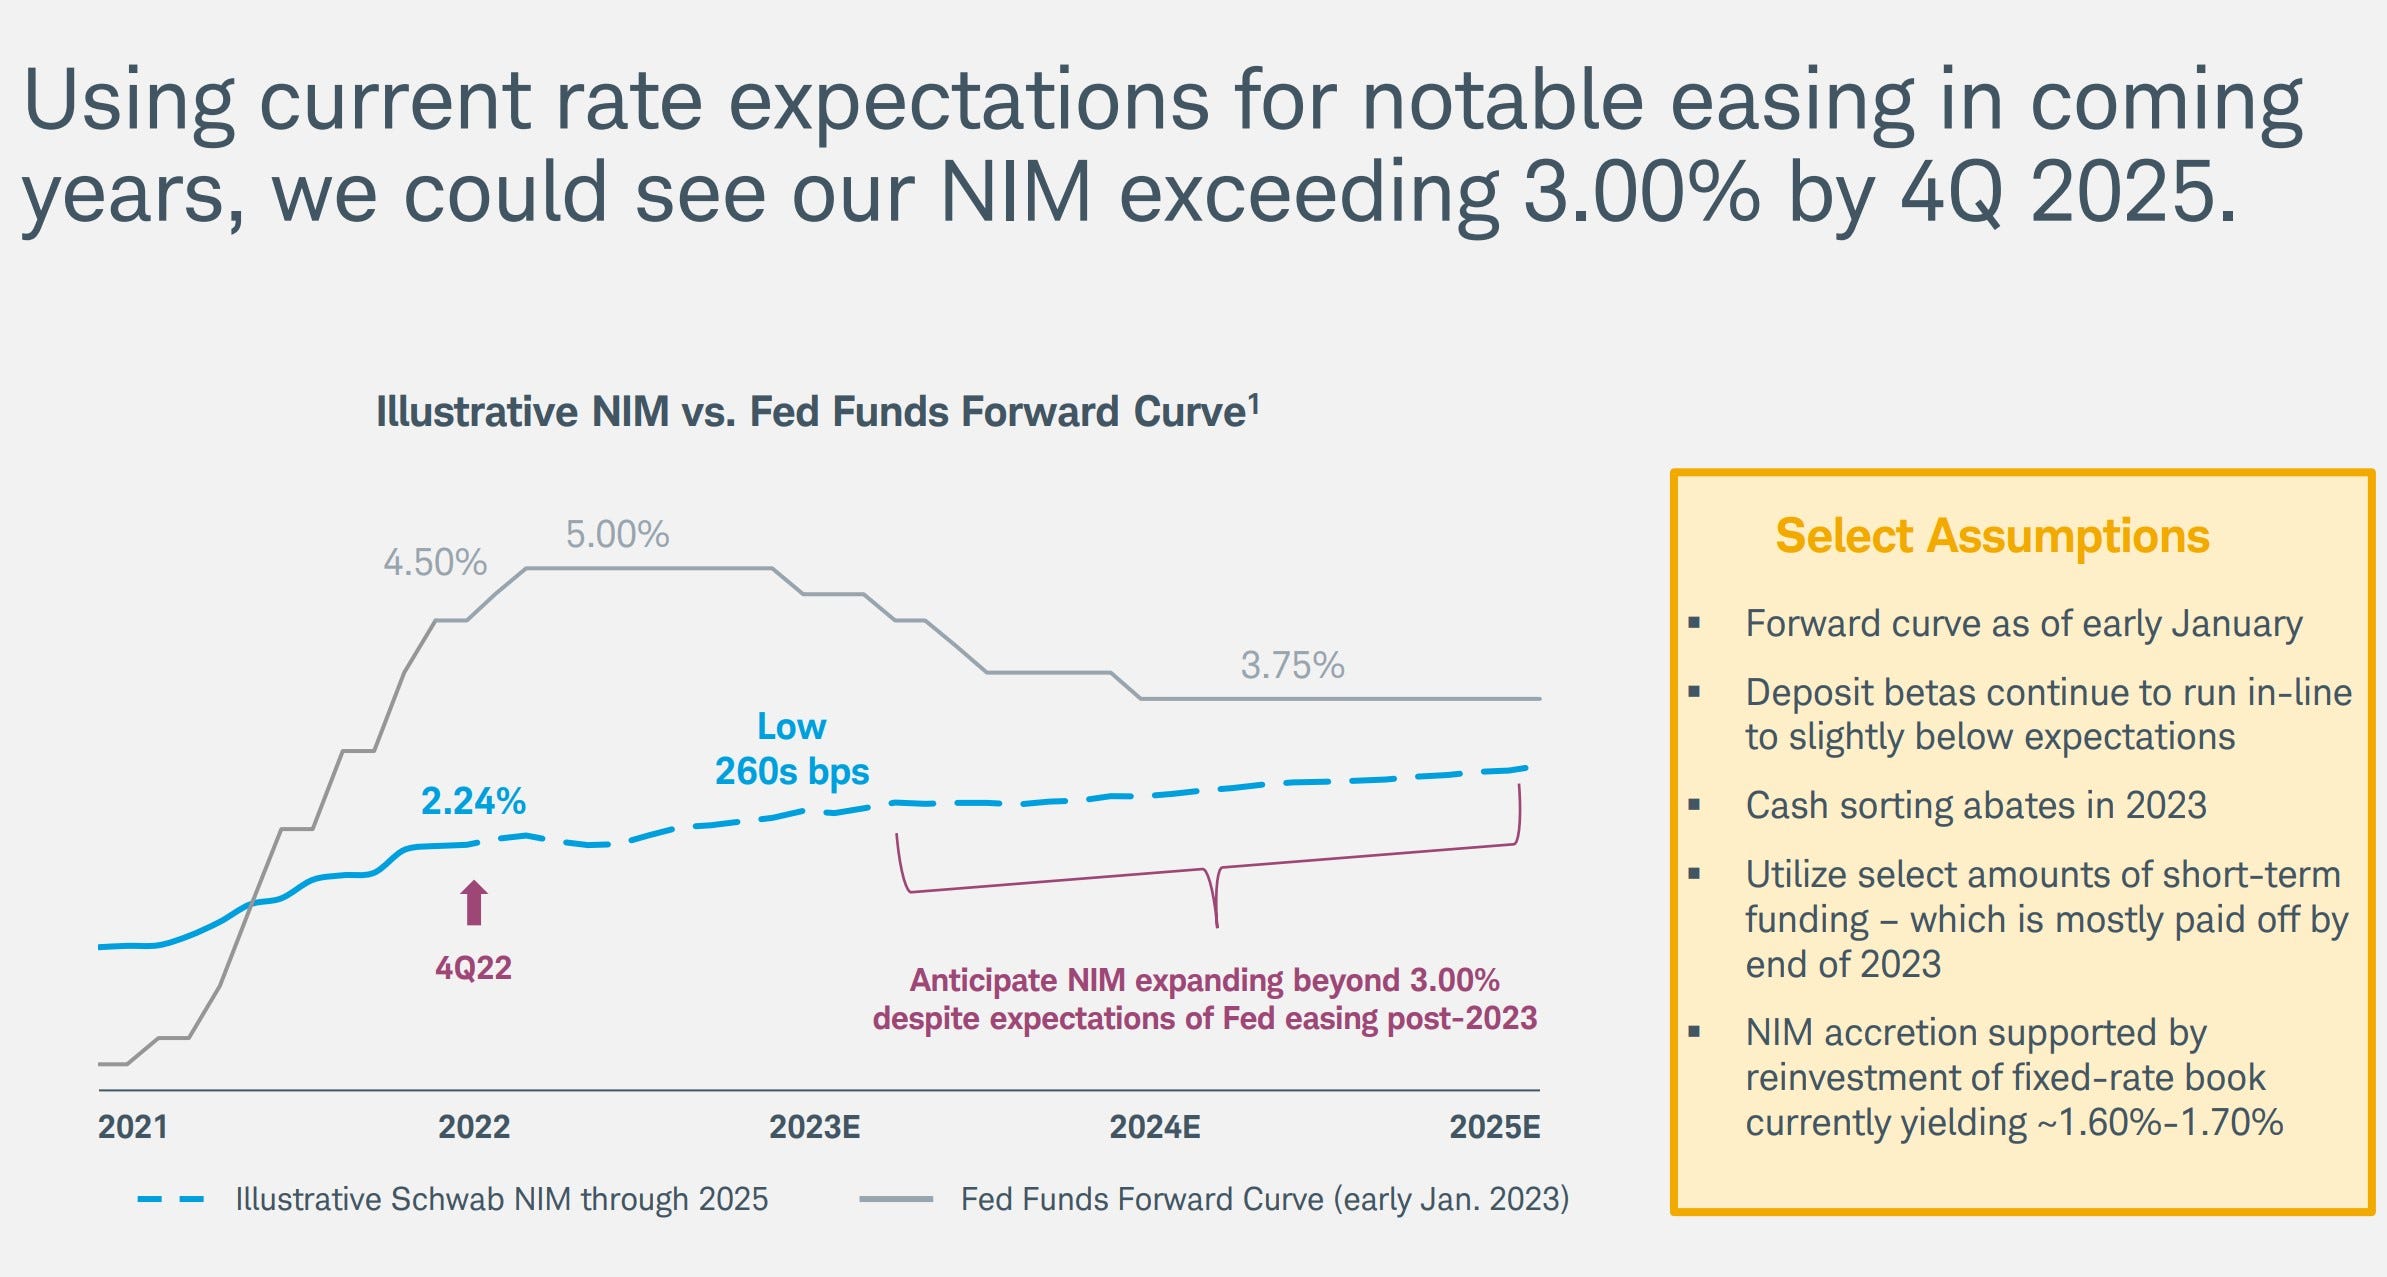
Those bears were right, but we argued that it didn’t really matter all that much. Barring a run on the bank — SVB’s failure was driven, at least in part, by customer realization that it was technically insolvent on an MTM basis — the current value of the asset base wasn’t the driver of the future value of the equity. Rather, it was earnings that mattered, and as low-yield government debt rolled off the books, to be replaced by higher-yielding paper, Schwab had a clear path to higher net interest margin and earnings per share:
source: Schwab presentation, January 2023
Right, Then Wrong?
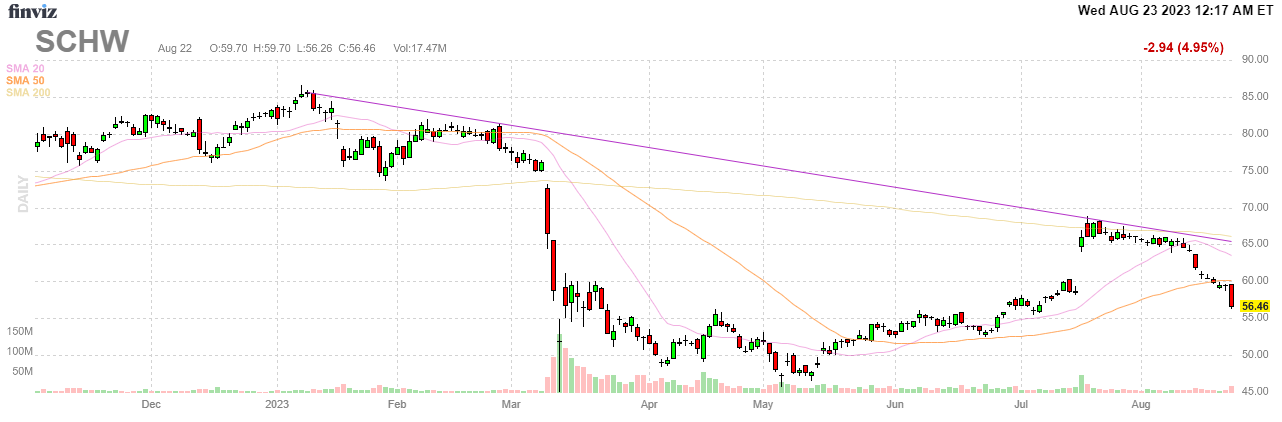
More broadly, the argument in mid-March was that nothing really had changed for Schwab post-SVB. And for about four months, our case worked out exceptionally well. Management stayed positive and SCHW soaring after Q2 earnings last month seemed to support the bull case. Coming out of the release, the stock had recaptured most of its March losses, and had rallied more than 30% since our call:
source: finviz.com
But of late, fears have returned. A 5% plunge on Tuesday was the 11th straight decline for SCHW, its longest such streak in nearly 20 years. This time, the issue doesn’t appear to be the balance sheet, but the key risk we highlighted in March: cash sorting.
Schwab makes about half its revenue by simply ‘sweeping’ customer cash balances into its banking subsidiary, paying a small (in fact negligible) interest rate, and earning higher interest in longer-duration assets. But customers can now get dramatically higher rates than they could for most of the past decade, and so they are less likely to leave cash balances in their investment accounts to be swept.
As with the MTM losses, this issue was known long before March. Schwab management continues to insist that sorting trends this cycle are not much different than they’ve been in past rising-rate environments. A key reason why SCHW jumped was because management said that cash sorting behavior had normalized during Q2.
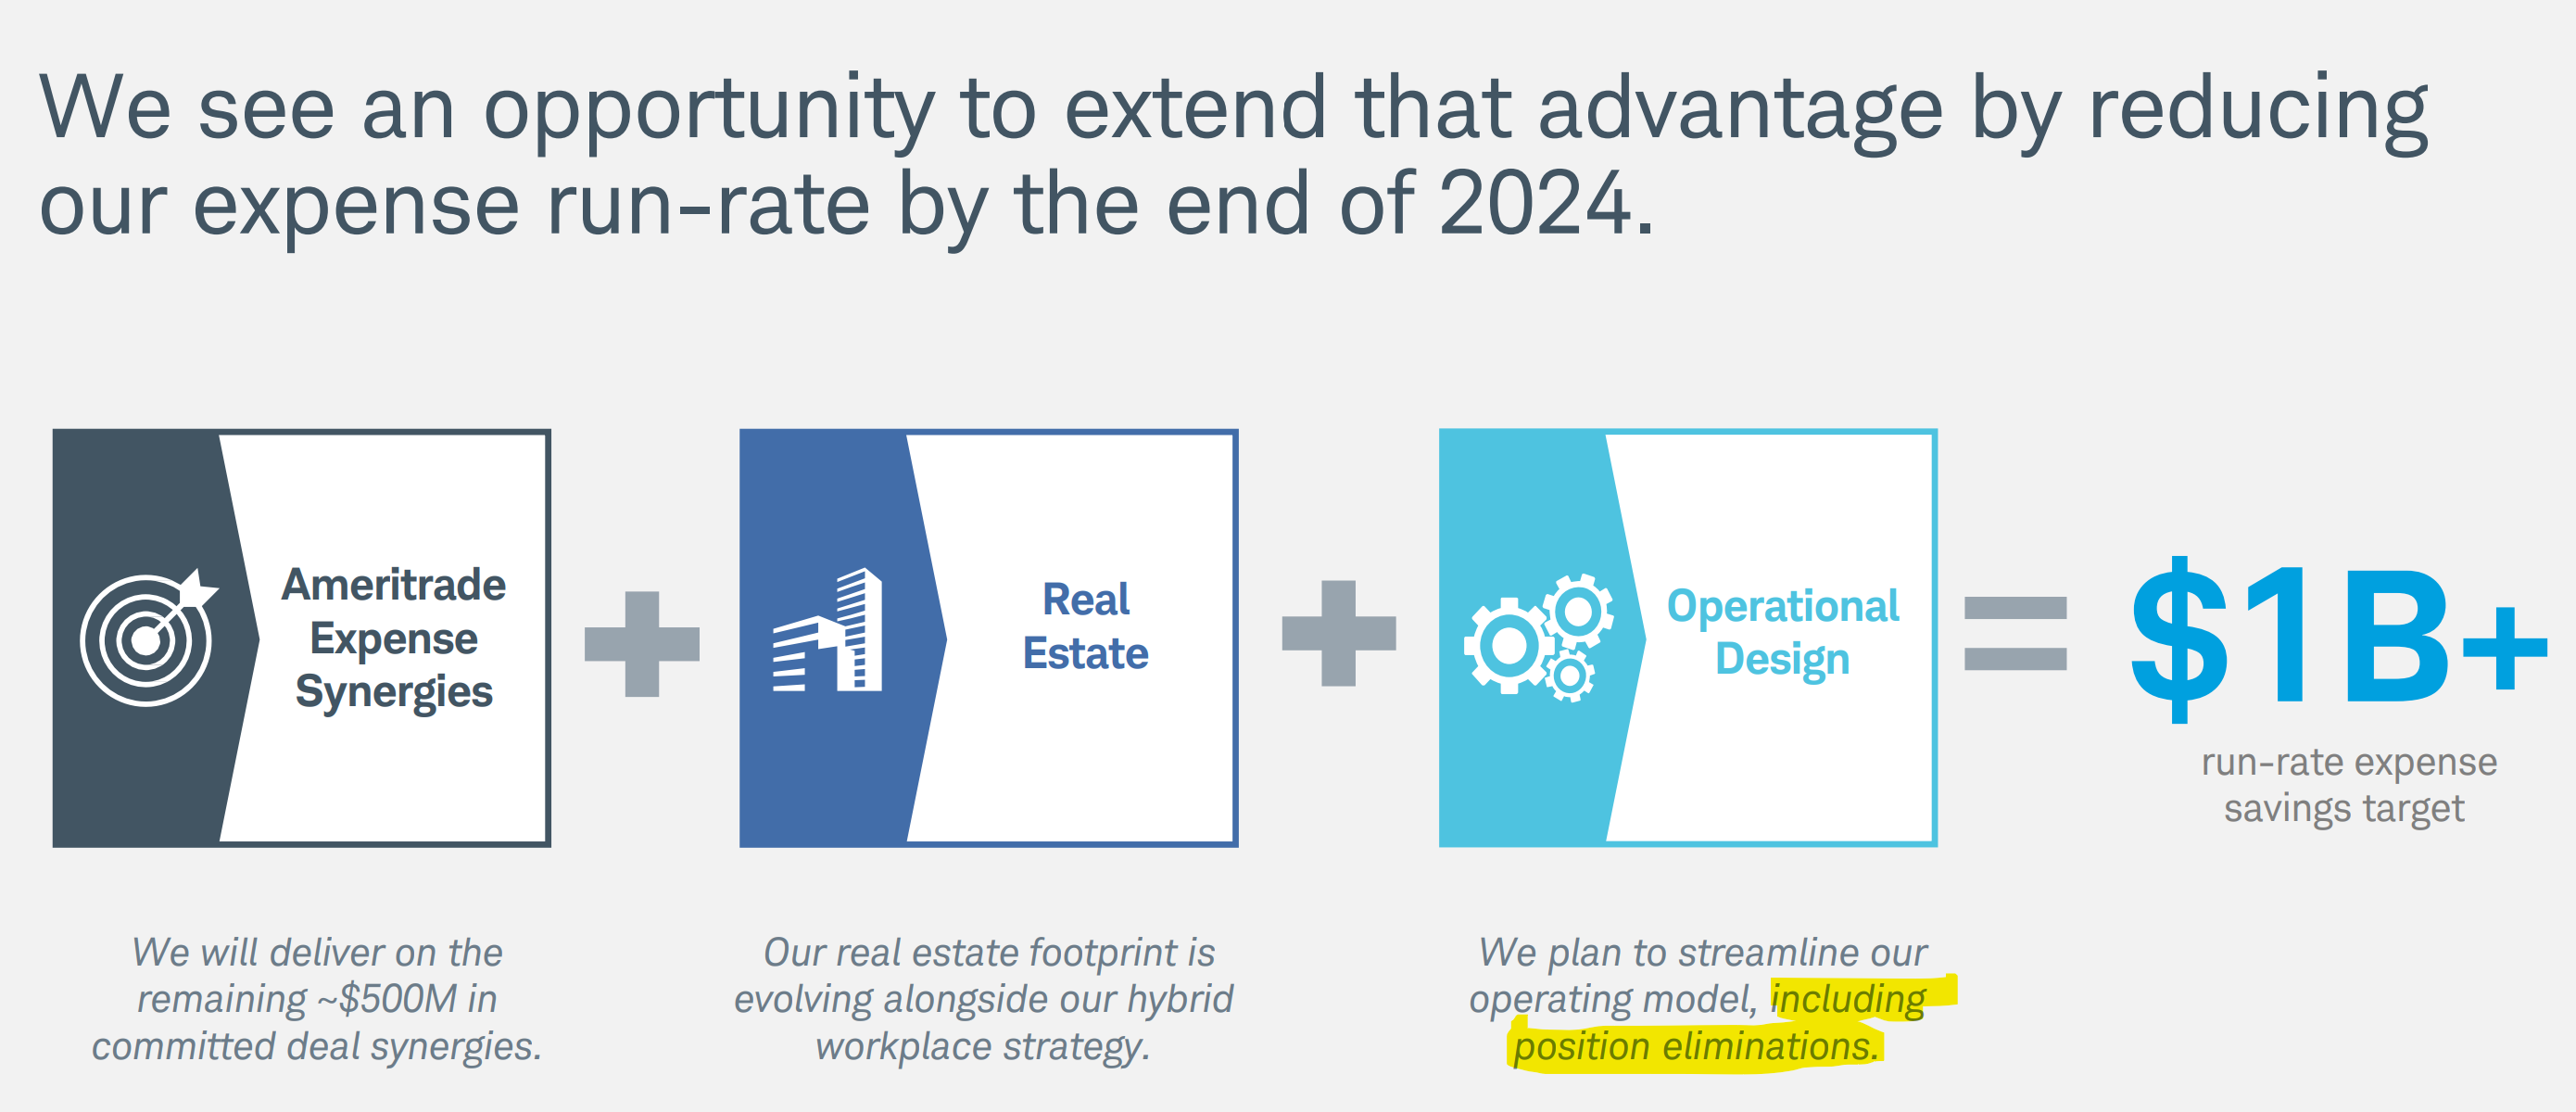
What has happened in August is that investors don’t seem quite as willing to trust management’s interpretation of customer behavior. Last week, Schwab’s chief financial officer cited “temporarily lower net flows” as customers of TD Ameritrade, which Schwab acquired in 2020, left the brokerage ahead of Ameritrade’s transition to Schwab branding. After the close on Monday, Schwab said in an 8-K filing that it would spend $400 to $500 million reducing both headcount and office square footage, leading to the aforementioned 5% decline in SCHW on Tuesday.
In both cases, investor concern makes a bit of sense. Schwab’s management team wouldn’t be the first to mistake substantive customer changes for simple friction around an acquisition. And the aggressive cost cuts seem to counteract the expressed optimism from Schwab that all is essentially the same as was expected six months ago.
Staying The Course With SCHW
For now, however, we’re sticking with our original interpretation. As the slide above shows, before SVB Schwab expected net interest margin “could” clear 3.00% by the fourth quarter of 2025. The current outlook isn’t terribly different: Schwab said last month that it did see NIM of “nearly 3.00% during late 2025”. Higher (and higher-rate) borrowings required to get through this period should be paid off by the end of next year. Essentially, SCHW’s 2023 and 2024 earnings are being hit, but the long-term outlook remains relatively intact.
As for the news of late, the Ameritrade disruption shouldn’t be a surprise. The workforce and office space reductions absolutely should not be. In the same July update that led SCHW to soar, the company tipped precisely the actions that led to a sell-off on Tuesday:
source: Schwab July business update presentation; highlighting by author
This is still one of the great American businesses of the past 50 years, available at a price created (once again) by short-term worries.
The March panic around regional banks created no shortage of opportunities, many of which have played out better than SCHW has. But as we wrote then, none of those opportunities were in a more attractive business than Charles Schwab. To our eye, this sell-off is creating that opportunity once again.
As of this writing, Vince Martin is long SCHW. He has no positions in any securities mentioned.
Disclaimer: The information in this newsletter is not and should not be construed as investment advice. Overlooked Alpha is for information, entertainment purposes only. Contributors are not registered financial advisors and do not purport to tell or recommend which securities customers should buy or sell for themselves. We strive to provide accurate analysis but mistakes and errors do occur. No warranty is made to the accuracy, completeness or correctness of the information provided. The information in the publication may become outdated and there is no obligation to update any such information. Past performance is not a guide to future performance, future returns are not guaranteed, and a loss of original capital may occur. Contributors may hold or acquire securities covered in this publication, and may purchase or sell such securities at any time, including security positions that are inconsistent or contrary to positions mentioned in this publication, all without prior notice to any of the subscribers to this publication. Investors should make their own decisions regarding the prospects of any company discussed herein based on such investors’ own review of publicly available information and should not rely on the information contained herein.
Technically, it rose 99.96%, falling one penny shy of a double.
Really nice update on $SCHW
Regarding $FTCH, I'm not sure if everyone's paying attention (amidst the all the panic selling), but on the 2Q23 earnings call, mgt. actually mentioned that by year end (2023), they can get to 800M of cash on the balance sheet ("we now expect to deliver cash and cash equivalents of over $800 million at year end). Apparently I think this is significant - it would mean FTCH is guiding 170mn of FCF in 3Q/4Q EACH in order for cash balance to increase to 800mn from 454mn as of 6/30/23. If you annualize 170mn of FCF/Q, that's 680mn of steady state FCF, v. current 1.8Bn TEV, that's 40% yield on TEV. I mean whether or not they can deliver is a big ?, but I don't think people really went thru all the numbers and details on the FTCH 2Q23 call as they were desperately selling.