Fundamentals: What Bond Prices Mean For Stocks
Credit markets can be a valuable source of information for equity investors
This is another installment of our Fundamentals series, and the second tackling the issue of debt. In the first instalment, we looked at the different types of corporate debt, and what it means for shareholders. In this instalment, we’re going to zero in on corporate bond prices, which can impart tremendously valuable information.
Debt Matters
Company filings show how much debt a company has outstanding at the end of a reporting period. For instance, at the end of its fiscal second quarter, Procter & Gamble PG 0.00%↑ had $33.7 billion in total debt:
source: P&G 10-Q
This figure is important. As we’ve discussed before, it’s used to help calculate enterprise value which essentially is the valuation of the entire business. And the ratio of gross debt (debt net of cash) to EBITDA can provide a snapshot of a company’s leverage and financial stability.
In many cases, the total amount of debt is all an investor really needs to know. Often, the specific details of a company’s borrowings aren’t that important and generally speaking, the more stable the business, the less the details matter. P&G, for example, is a blue-chip issuer. The company is not going bankrupt. Its interest expense impacts cash flow; its debt net of cash affects valuation. The precise maturity and even interest rates of its particular bonds, however, are immaterial.
In fact, even in an almost unprecedented environment in terms of interest rates, the actual interest rate on specific bonds isn’t terribly important for a mature issuer. Debt issued during the low-rate environment of the 2010s that matures this decade will have to be refinanced at higher rates — but that impact is relatively minimal for most companies.
For instance, AT&T T 0.00%↑ is the world’s most indebted company, but with nearly $24 billion in bonds maturing between 2024 and 2026, the impact to interest expense from refinancing is maybe $1 billion, and likely less. That matters, certainly, but the figure represents about 5% of guided 2024 free cash flow. AT&T’s aggressive efforts to pay down debt will offset some of that increased expense as well.
However, for small or higher-risk companies, bond prices carry enormously important information. They can highlight whether a company is exposed to refinancing risk — and whether a company is exposed to bankruptcy risk.
Where Do You Find Bond Prices?
We’ll start with a primer on actually finding bond prices. In the U.S., transactions of the corporate bond in the secondary market (ie, between financial industry participants rather than with the company itself) are reported to FINRA, the Financial Industry Regulatory Authority. Helpfully, FINRA makes that data available to the public.
Last year, FINRA redesigned the website, and the new version unfortunately is far less intuitive than the old one. The top field on the home page suggests a TRACE1 or CUSIP2, but neither is easy to find unless an investor already knows which specific bond she is looking for. Instead, the way to go is to the “Browse Bonds” list below:
source: Finra
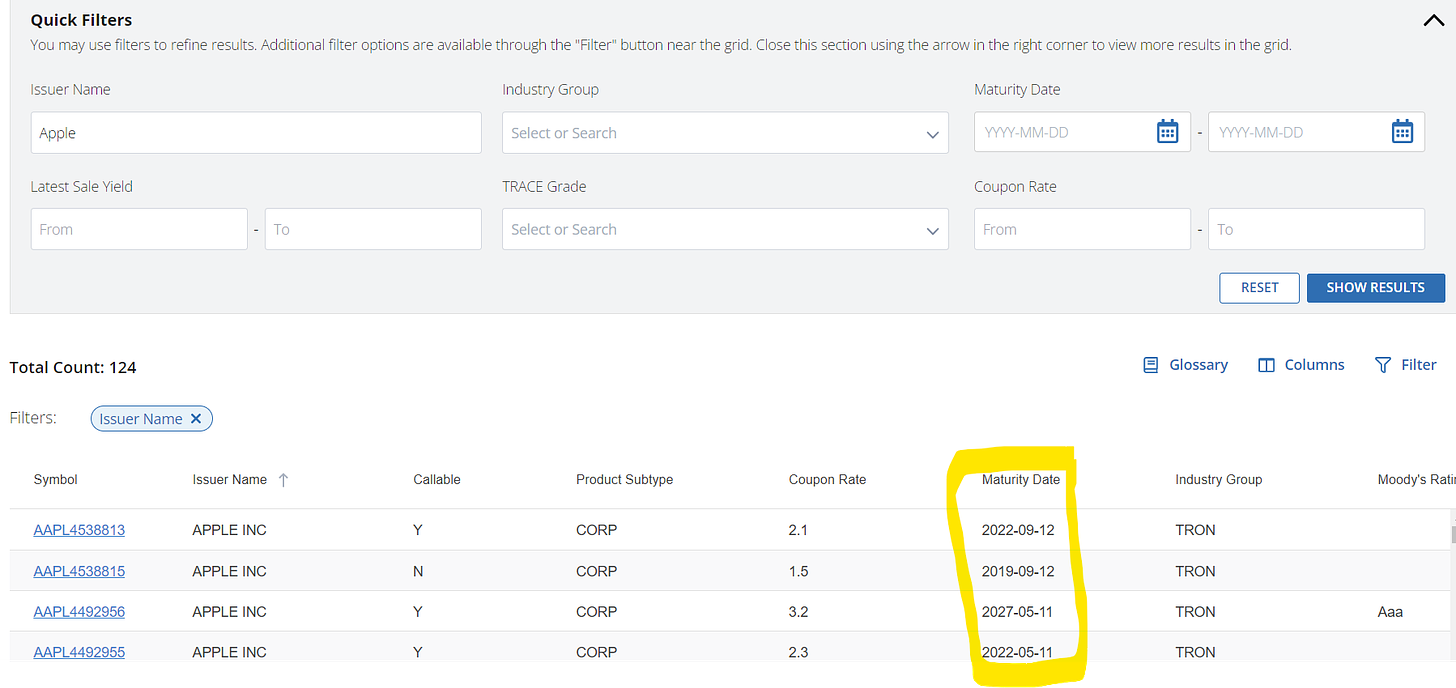
After clicking through a page, an investor will find a search engine:
source: Finra
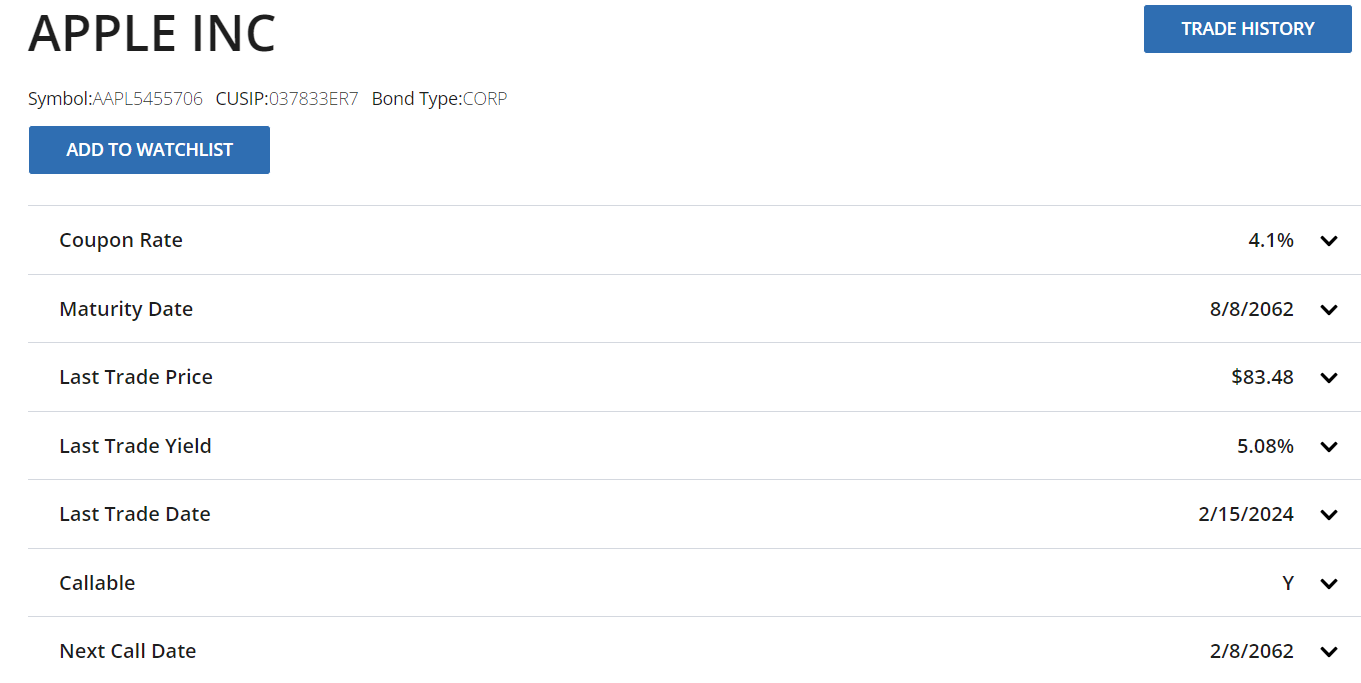
The highlighted column is the “maturity date”. In other words, when the bond comes due. Three of the four bonds in the screenshot already have matured. The list is sortable, however, so clicking on “maturity date” will put the longest-maturing bonds first (Apple has one bond that does not mature until 2062). Investors can then click on the symbol column to see information for the specific bond:
source: Finra
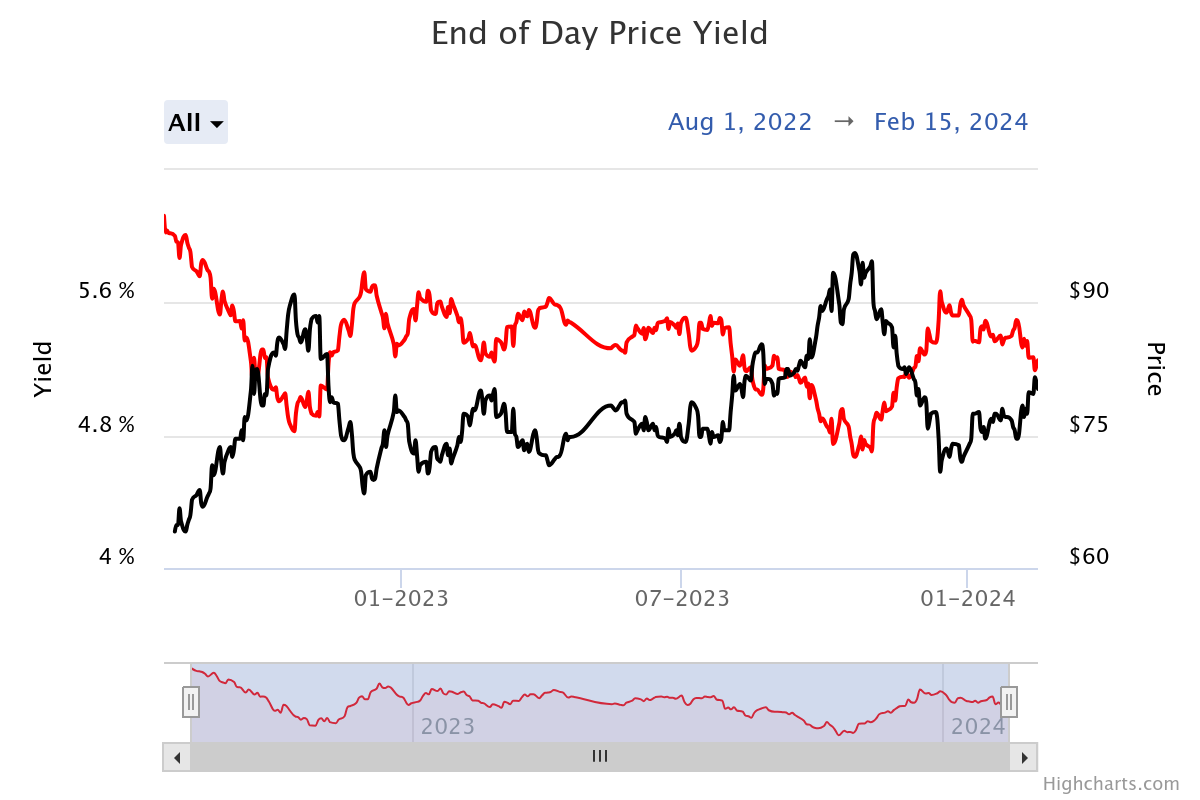
Helpfully, the down arrows on the right open up detailed, investor-friendly, explanations of the various attributes. Below that is a price to yield chart (remember that price and yield move in inverse directions; price here is in red):
source: Finra
With this easily accessible data, investors can have a better understanding of how a company’s specific bonds are trading.
Spread In The Secondary Market
As we wrote in our last piece, floating-rate debt trades (almost always) at a spread to rates that are risk-free or close. The standard benchmark has become SOFR, the Secured Overnight Financing Rate, which measures the interest rate for borrowing cash overnight with U.S. Treasury bonds as collateral.
In the secondary markets, fixed-rate debt also trades at a spread. We know the risk-free rate for a given period: it’s usually defined in the yield in U.S. Treasuries over that period. And we know the YTM (yield to maturity), which represents not just the coupon (the interest rate paid based on the par value of the debt) but the difference between the par value and the current price, pro-rated for the time to maturity.
YTM assumes that interest payments are reinvested (a simple Google search will show many effective calculators) but to provide an oversimplified example, imagine a $1,000 face value bond trading at 923 with zero interest that matures in a year. The investor pays $920; after one year, she receives $1,000. Her YTM is ~8.7% (total return is $80 on a $920 investment).
As a result, YTM figures provide an excellent proxy for what borrowing costs would be if the company issued or refinanced debt. YTM is the yield that credit market participants accept for owning debt in the secondary market. Almost always, the interest a company would have to pay in the primary market (ie, through issuing debt itself) is going to be roughly the same.
That assumes, of course, that the debt is the same. In a restructuring, secured or first-lien debt will have a higher-priority claim on the company’s assets. And so unsecured debt will, particularly in a distressed situation, have a much higher yield than secured issues. If the company can’t issue more secured debt (usually because all assets are already pledged as collateral for outstanding first-lien borrowing), it’s the outstanding unsecured issues that provide a better proxy for the company’s ability to issue new debt.
Meanwhile, secondary debt markets are based on the participants’ understanding of YTM relative to the risk-free rate. No one would accept, say, a 3% YTM on a 10-year bond from even the best company, when they get a 4.3% yield in a U.S. Treasury bond that matures at the same time. And so the spread between the yield of an existing bond, and the yield of Treasury bonds with the same maturity provides an important indicator of the financial health of the business.
source: Daily Treasury yield curve, U.S. Treasury
The Spread To Risk-Free
For instance, an Apple 1.65% corporate bond maturing in February 2031 last traded at a price of 82.74, for a yield to maturity of 4.57%. A U.S. Treasury bond (used as a ‘risk-free’ proxy) traded at a yield of 4.16%. The spread of 41 basis points (or 0.41%) is obviously quite small. So investors are pricing in a vanishingly small possibility of Apple going bankrupt between now and 2031.
Sensor manufacturer Sensata Technologies ST 0.00%↑ also has a bond maturing in February 2031. That bond last traded at a yield of 6.10%, a spread of 194 basis points. That suggests the credit markets see some risk that Sensata could get into trouble — but not a huge risk. Sensata is not Apple — but what company is?
But there is also Bausch Health BHC 0.00%↑, the former Valeant Pharmaceuticals that went on a debt-fueled acquisition spree in the 2010s. Its 5.25% bonds that mature in February 2031 have a yield to maturity of 21.74% — a spread of 1,758 basis points. That, obviously, is huge. The high yield is in part because those bonds are unsecured: if Bausch were to declare bankruptcy between now and 2031, owners of these particular bonds might well be wiped out.
The difference between these three bonds doesn’t necessarily mean that any of the three companies is a better equity investment. But what the credit markets offer is an exceptionally useful measure of downside risk.
Indeed, there is a school of thought that when it comes to risk, bond prices provide more valuable information than equity prices. There’s a logic to that (one to which I personally subscribe): debt investors by definition are focused on risk, because the upside is almost always capped.
An investor who owns Bausch bonds doesn’t get more money if the company’s profits surprisingly triple. She gets a nice yield if the bonds are paid off; she likely loses money if Bausch goes bankrupt between now and 2031. Depending on the nature of the bond and the value of the business, she could lose only a portion as she gets equity ownership in a Chapter 11 bankruptcy. Or she could be wiped out if the assets are worth so much less than the debt that only secured bondholders get a portion of their money back.
So all our credit investor really cares about is the odds of Bausch repaying that debt, along with the potential recovery in a bankruptcy. All she cares about is risk. As a result, yields in the secondary credit market reflect the combined calculation of experienced, professional bond investors of the risk inherent in a company’s debt.
Quite obviously, that is hugely valuable information for equity investors. Because in nearly all cases, if bond investors lose money, equity investors lose all of their money when they are wiped out in a restructuring4.
What The Spread Tells Us About Bausch
So we know how to find bond prices and yields, and we can understand the spread of that yield to the risk-free rate implied by U.S. Treasuries. But, at the risk of being anticlimactic, that doesn’t always mean that the information is useful.
Again, for most companies the actual price of the bonds isn’t that important. Whether the spread of a specific Apple bond to the risk-free rate is 41 basis points or 61 basis points has really no bearing on the equity.
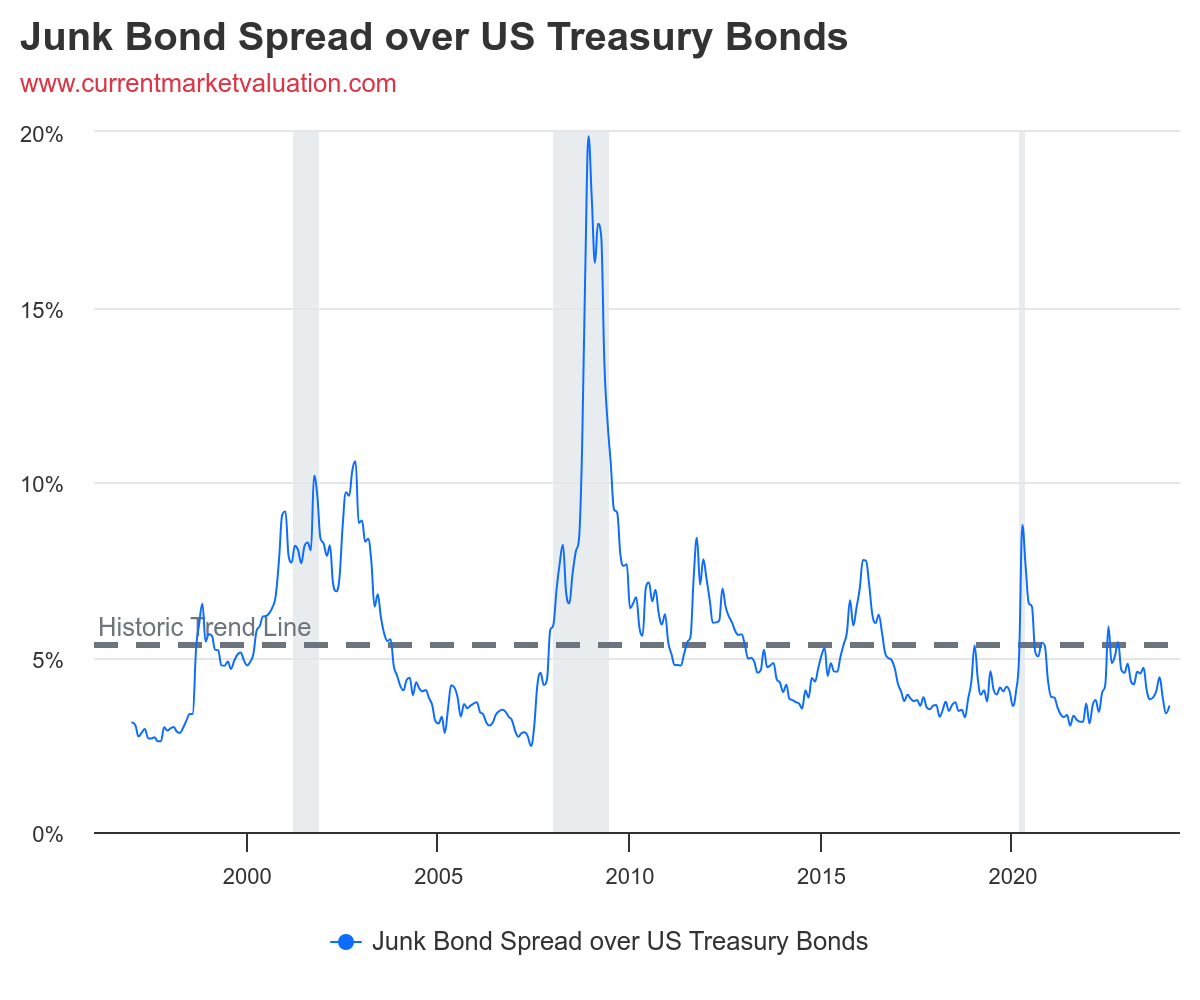
For Sensata, the bond price does provide a bit of comfort that credit investors, at least, see the business as reasonably consistent and well-protected. That’s particularly true because the company has a decent amount of debt: nearly $3 billion net of cash, more than half its market cap and a little over 3x 2023 Adjusted EBITDA. In that context, a spread under 200 basis points is rather slim, since high-yield bonds (also referred to as ‘junk’ bonds) usually offer a much higher spread:
source: CurrentMarketValuation.com
Where bond prices get more useful is with a company like Bausch. Right now, Bausch stock trades for 2.23x the consensus estimate for 2024 adjusted earnings per share. To be clear, we didn’t miss a decimal point: Bausch’s forward P/E is 2.23x. And that’s with the Street estimating that EPS will increase about 12% this year, on top of 10%-plus growth in 2023.
The combination of a stunning low P/E multiple along with EPS growth would seem to suggest that BHC stock is an absolute steal — one of the best buys in the entire market. But the credit markets are telling us otherwise. The 20%+ yield to maturity in the 2031 issue means that there is a significant probability of bankruptcy in the next couple of years.
How significant? It’s difficult to precisely calculate. But in our next installment, we’ll use that highly indebted company as a model for understanding the interplay between debt and equity, and how to use data from the credit market to inform decisions in the stock market.
As of this writing, Vince Martin has no positions in any securities mentioned.
Disclaimer: The information in this newsletter is not and should not be construed as investment advice. Overlooked Alpha is for information, entertainment purposes only. Contributors are not registered financial advisors and do not purport to tell or recommend which securities customers should buy or sell for themselves. We strive to provide accurate analysis but mistakes and errors do occur. No warranty is made to the accuracy, completeness or correctness of the information provided. The information in the publication may become outdated and there is no obligation to update any such information. Past performance is not a guide to future performance, future returns are not guaranteed, and a loss of original capital may occur. Contributors may hold or acquire securities covered in this publication, and may purchase or sell such securities at any time, including security positions that are inconsistent or contrary to positions mentioned in this publication, all without prior notice to any of the subscribers to this publication. Investors should make their own decisions regarding the prospects of any company discussed herein based on such investors’ own review of publicly available information and should not rely on the information contained herein.
Trade Reporting and Compliance Engine
Committee on Uniform Securities Identification Procedures
Bond prices are usually expressed in percentages, not dollars. A $1,000 par value trading at 92 costs $920.
There are some exceptions in which shareholders do get something in a bankruptcy. Two of the most famous are Hertz HTZ 0.00%↑ in 2021 and mall operator General Growth Properties in 2010. But those exceptions are rare.


